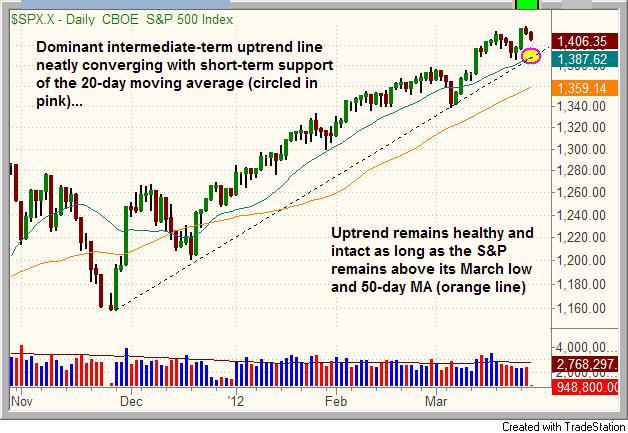
Since a picture is worth the proverbial thousand words, take a look at this simple daily chart of the S&P 500 (as a proxy for the broad market):
The market will certainly correct, but the uptrend clearly remains healthy. In addition to what is shown on the chart above, it would require both the 50-day moving average to turn down AND the 20-day moving average to cross below the 50-day moving average for the uptrend to end. For now, follow the uptrend while it lasts…
As Bitcoin breaks through critical resistance levels, seasoned traders are eyeing both opportunities and warning signs in today's volatile crypto…
While most investors are running for the exits, savvy traders are quietly building watchlists of stocks showing remarkable resilience. These…
When bullish momentum turns on a dime - navigating the treacherous waters of failed breakouts The markets can be merciless…
In today's volatile market environment, understanding technical indicators and market positioning is crucial for traders. Rick Pedicelli, a seasoned trader…
The Nasdaq 100 ETF (QQQ) has reached new all-time highs, presenting traders with fresh opportunities. Understanding key support levels becomes…
Missed the initial breakout? Don't worry - there's still a chance to catch that rocket! Today, we're diving deep into…