The following commentary is an excerpt from today’s Wagner Daily ETF and stock newsletter…enjoy!
As the second quarter of 2012 kicks off preceded by a very bullish first quarter, it’s the perfect time to take an updated look at key technical levels of support and resistance on the main stock market indexes. Although we do not directly base our swing trading decisions solely on the patterns of the major indices, it’s always good to have the “big picture” in the back of your mind.
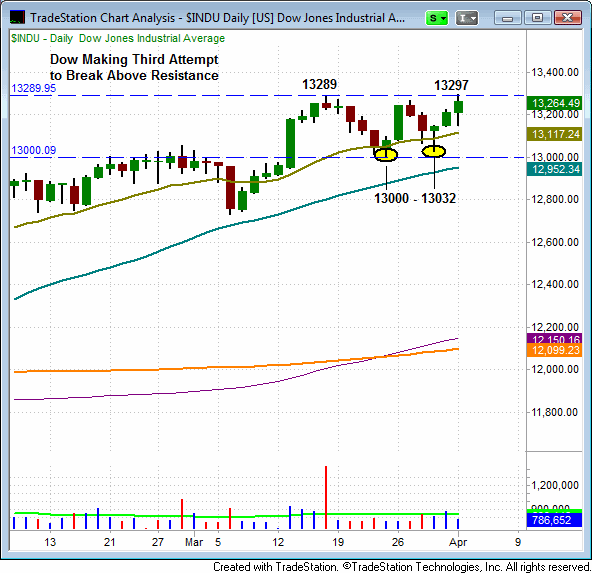
Listed below are the key support and resistance levels in the broad market averages (daily and weekly charts of the Dow Jones Industrial Average, Nasdaq Composite and S&P 500). Yesterday, the Dow Jones Industrial Average set a new 52-week intraday and closing high. However, the Dow was unable to break out of its three-week trading range and the move occurred on light volume. We wouldn’t be surprised to see a failed breakout at the 13,300 mark if the Dow is to move to significantly higher ground. If the Dow can take out the 13,300 mark, the next big resistance is near 13,800 (see weekly chart below). Near and intermediate-term support levels on the Dow include the 20-day EMA (13,120), the 50-day MA (12,950) and the prior “swing lows” at 13,030 and 13,000 (shown on the daily chart below):

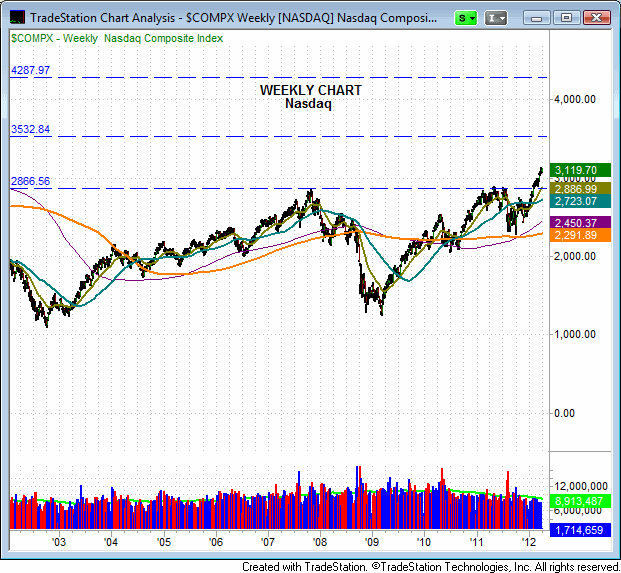
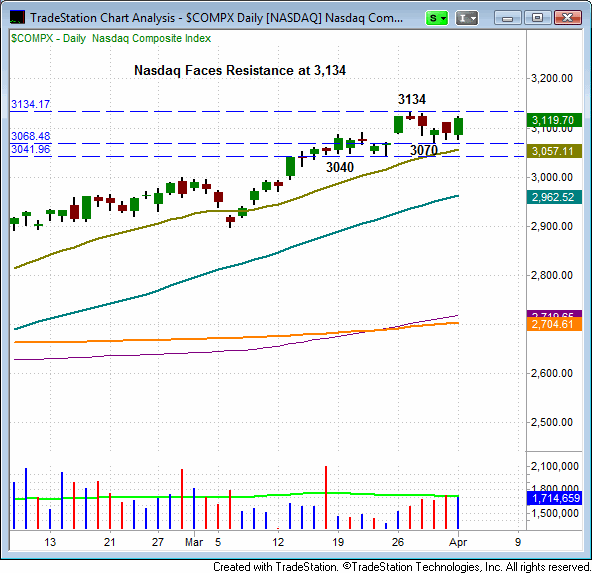
The Nasdaq Composite has been leading this current leg of the rally higher. However, unlike the Dow and the S&P 500, the Nasdaq failed to establish a new 52-week high yesterday. This price action may suggest that the Nasdaq needs to consolidate and “take a rest” prior to a potential move higher. The Nasdaq faces near-term resistance at 3,134, and has support near 3,070 and 3,040. On the weekly chart (the first chart below), you will notice that the Nasdaq is the only index that has cleared its 2007 high. Further, the Nasdaq is currently at an 11-year high. The next major resistance level on the Nasdaq is near 3,530 (shown on the second chart below).
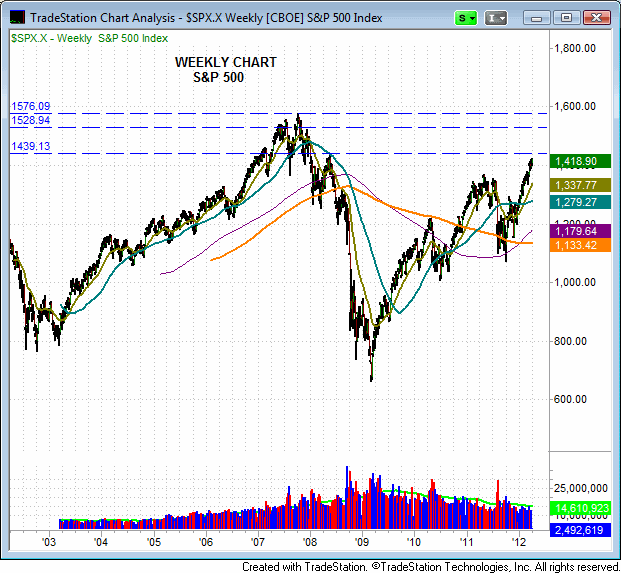
The benchmark S&P 500 attempted to break through resistance at 1,420 yesterday, but it fell just short as it closed below this key mark. Short-term support levels on the S&P 500 include 1,392 and 1,387. If the S&P manages to clear the 1,420 level, its next key resistance is near 1,440:
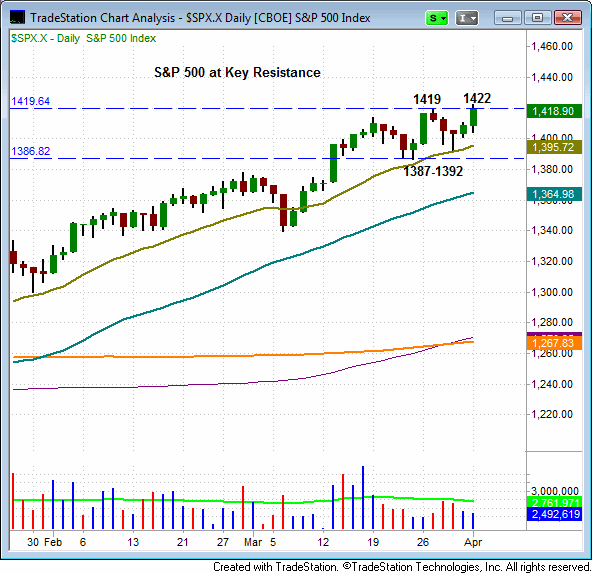
The market’s uptrend remains solid and the bulls are still in control, but a bit of sideways price consolidation from here would be healthy for the market. In the event of high volatility, rather than gentle consolidation, the daily charts above may help you keep the dominant trend and “big picture” in your mind.
The commentary above is a partial excerpt from The Wagner Daily, our nightly stock and ETF ETF and stock newsletter. Subscribing members additionally receive specific entry and exit prices for all swing trade setups, more technical market commentary, annotated ETF and stock charts, and access to our Live Trading Room. Click here to become a member for less than $2 per day (based on annual subscription). Your full satisfaction is guaranteed.
