Commentary:
Stocks responded favorably to Tuesday’s heavy volume selloff with a solid day of gains across the board in the major averages. After a slight pullback in the first hour of trading, most averages pushed higher throughout the day before giving back some gains late in the session. While the broad market averages could certainly correct for a week or two in a tight range, the odds do not favor the market rolling over given the current evidence. The MidCap 400 led with a 1.3% gain, while the Dow Jones Industrial Average was right behind at 1.2%. Both the small-cap Russell 2000 and S&P 500 increased by 1.1%. The Nasdaq Composite was a slight laggard on the at 0.8%.
Although turnover eased during yesterday’s advance (it would have been tough to beat Tuesday’s heavy volume), it did reach respectable levels by climbing above the 50-day volume moving average on both exchanges. NYSE volume fell 13%, while Nasdaq volume dropped 9% off the prior day’s pace. Advancing volume beat declining volume by a decent margin of 3 to 1 on the NYSE and 2.4 to 1 on the Nasdaq. As mentioned is yesterday’s report, we believe the rally will remain in good shape as long as the major averages stay away from multiple distribution days while in consolidation mode.
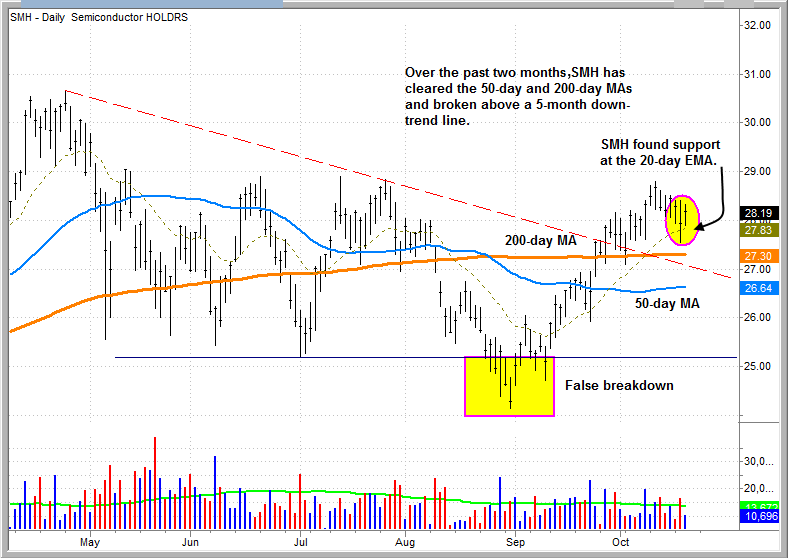
Along with the financials, the semiconductor index was an ugly laggard at the beginning of the current rally. While the broad market averages bottomed out with a higher low in late August, the HOLDRS Semiconductor ETF (SMH) set a lower low by breaking support at 25.00. However, the breakdown turned into a bear trap by reversing off the lows and rallying through the 50-day and 200-day moving averages. In late September, SMH generated a potential trend reversal signal by breaking through the five month downtrend line. SMH can confirm the downtrend line break by clearing the swing high from October 12. In the meantime, we expect the current consolidation to hold above the 200-day moving average at the very least (we had to use a bar chart to include the entire downtrend line).

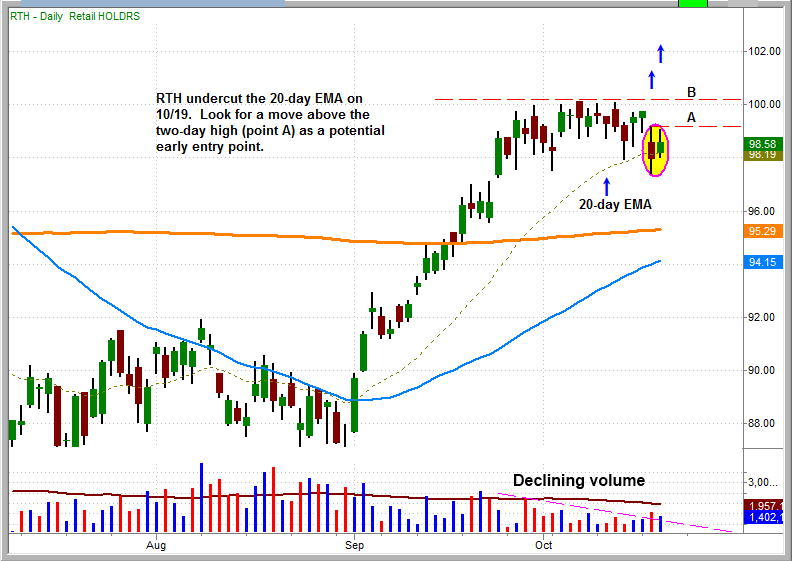
HOLDRS Retail (RTH) recently broke its downtrend line in July, with the confirmation of the break coming on the move out above 92.00 in September. RTH has formed a tight-ranged consolidation over the past few weeks near the highs of the move. Tuesday’s action undercut the rising 20-day EMA, but the price recovered to close off the lows of the day. A move above the two-day high around 99.20 (at point A on the chart below) is a potential early buy entry. One could add to the position on a heavy volume breakout above the current range high (point B).

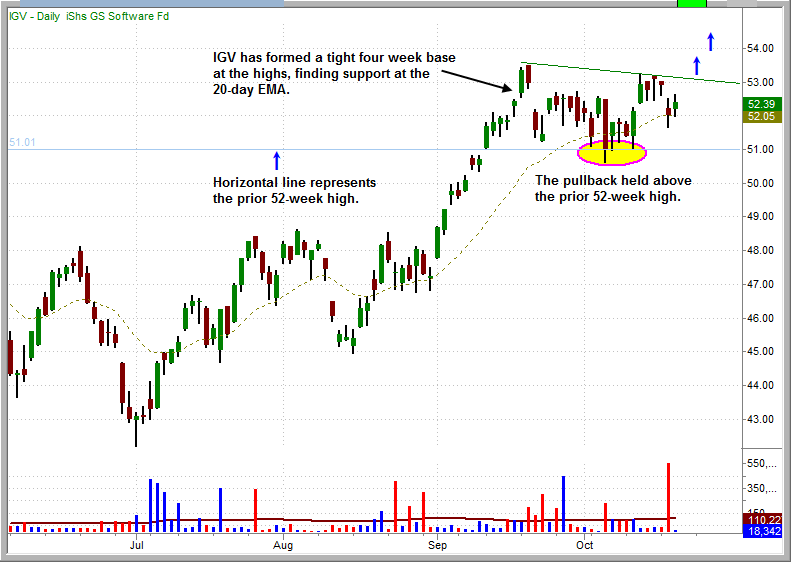
The iShares S&P GSTI Software Index Fund (IGV) recently broke out to new 52-week highs and is consolidating in a tight range over the past several weeks. IGV found support on the pullback from the rising 20-day EMA and prior 52-week high (the horizontal line at 51.00). There are a handful of component stocks in IGV forming bullish patterns such as TIBX, INFA, INTU, QSFT, CHKP, VRSN, and ADSK. Look for IGV to consolidate in a tight range for another week or two before it attempts to break above the downtrend line around 53.00.

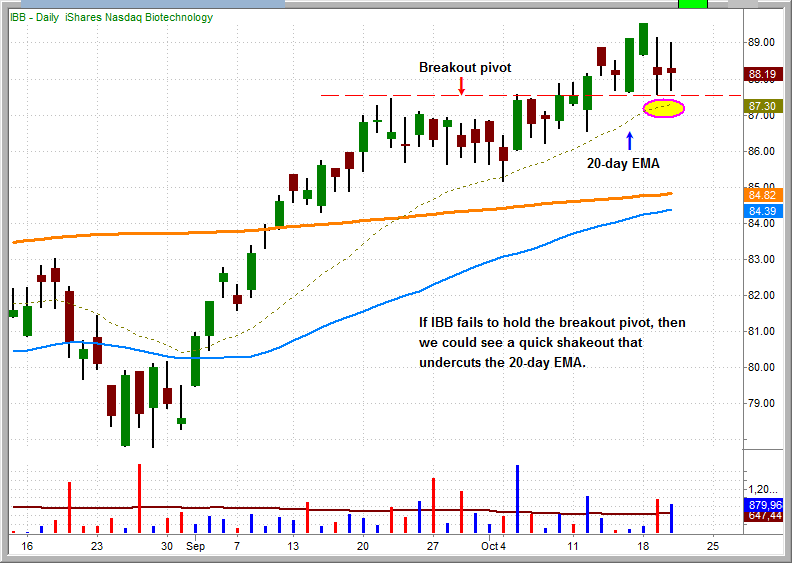
The iShares Nasdaq Biotechnology (IBB) is consolidating just above the breakout pivot. The lack of follow through on the breakout suggests that the price action may need one last shakeout before resuming its uptrend. A dip below the rising 20-day EMA around 87.00 would be the ideal shakeout scenario to scare off the remaining “weak” longs. That being said, if IBB clears the current two-day high it will likely spark a rally to the prior highs of March around 93.00.

Today’s Watchlist:
There are no new setups in the pre-market today. If anything catches our eye while trading we will promptly send an Intraday Trade Alert.
Daily Performance Report:
Below is an overview of all open positions, as well as a performance report on all positions that were closed only since the previous day’s newsletter. Net P/L figures are based on the $50,000 Wagner Daily model account size. Changes to open positions since the previous report are listed in red text below. Please review the Wagner Daily Subscriber Guide for important, automatic rules on trigger and stop prices
No changes in open positions at this time.- Reminder to subscribers – Intraday Trade Alerts to your e-mail and/or mobile phone are normally only sent to indicate a CHANGE to the pre-market plan that is detailed in each morning’s Wagner Daily. We sometimes send a courtesy alert just to confirm action that was already detailed in the pre-market newsletter, but this is not always the case. If no alert is received to the contrary, one should always assume we’re honoring all stops and trigger prices listed in each morning’s Wagner Daily. But whenever CHANGES to the pre-market stops or trigger prices are necessary, alerts are sent on an AS-NEEDED basis. Just a reminder of the purpose of Intraday Trade Alerts.
- For those of you whose ISPs occasionally deliver your e-mail with a delay, make sure you’re signed up to receive our free text message alerts sent to your mobile phone. This provides a great way to have redundancy on all Intraday Trade Alerts. Send your request to [email protected] if not already set up for this value-added feature we provide to subscribers.

Having trouble seeing the position summary graphic above?
Click here to view it directly on your Internet browser instead.
Notes:
Edited by Deron Wagner,
MTG Founder and
Head Trader