market timing model:
Buy – Signal generated on the close of November 23 (click here for more details)
today’s watchlist (potential trade entries):

Having trouble seeing the open positions graphic above? Click here to view it directly on your web browser instead.
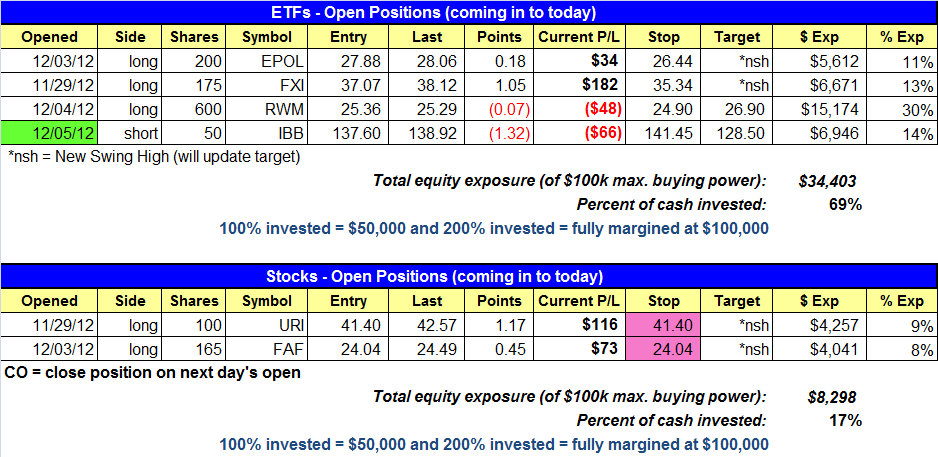
open positions:
Below is an overview of all open positions, as well as a report on all positions that were closed only since the previous day’s newsletter. Net P/L figures are based on two separate $50,000 model portfolios (one for ETFs and one for stocks). Changes to open positions since the previous report are listed in pink shaded cells below. Be sure to read the Wagner Daily subscriber guide for important, automatic rules on trade entries and exits.
Having trouble seeing the open positions graphic above? Click here to view it directly on your web browser instead.
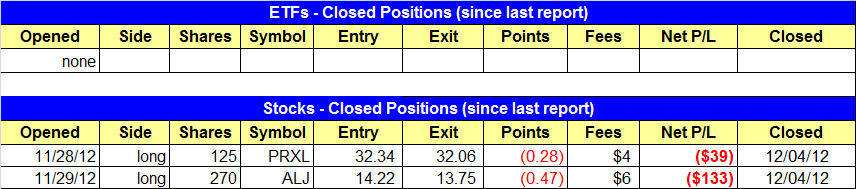
closed positions:
Having trouble seeing the closed positions graphic above? Click here to view it directly on your web browser instead.
ETF position notes:
- $IBB short entry triggered.
stock position notes:
- Sold $ALJ and $PRXL on the open.
ETF and broad market commentary:
Yesterday was a tale of two markets, as the main stock market indexes diverged substantially. Led by strength in the financial sector, the blue-chip Dow Jones Industrial Average ($DJIA) gained 0.6% yesterday, but a 6.4% plunge in heavily-weighted Apple ($AAPL) weighed on the tech-heavy Nasdaq Composite, which fell 0.8%. The S&P 500 ($SPX) edged 0.2% higher. The small-cap Russell 2000 ($RUT) and S&P Midcap 400 ($MID) indices slipped 0.2% and rose 0.2% respectively.
Turnover in the NYSE jumped 26% above the previous day’s level, as the S&P 500 formed a bullish reversal day on higher volume. Total volume in the Nasdaq ticked just 1% higher, but the high volume selling still caused the index to register a bearish “distribution day” that was indicative of institutional selling.
Yesterday, our open position in iShares China Xinhua 25 Index ($FXI) surged 3% higher to close at its highest level since May of 2012. It did so after breaking out above a bullish “pennant” formation,” which is shown on the daily chart below. More importantly, notice that the breakout occurred on more than double its average volume:

In addition to the breakout in FXI, our position in iShares Poland Index ($EPOL) continued acting well by gaining 0.5% and closing at another fresh 52-week high. Because it’s now becoming a bit extended away from near-term support of its 20-day exponential moving average, it would not be surprising to see a modest pullback to the recent breakout level. But even better would be for the ETF to now formed a period of sideways price consolidation (“a correction by time”).
When assessing the current chart patterns of our universe of about 300 tradeable ETFs we monitor daily, it continues to be international ETFs, rather than domestic industry sector ETFs, that are showing the most relative strength to the S&P and Nasdaq.
In addition to $EPOL, a handful of other European ETFs have been starting to act quite well. Both the iShares Turkey Index ($TUR) and iShares Austria Index ($EWO) have been surging higher over the past couple days and both ETFs are trading at new 52-week highs. Other European ETFs that have suddenly started seeing positive money flow include Switzerland ($EWL), Italy ($EWI), and Spain ($EWO). Of course, many European ETFs were beaten pretty badly during the Greece debacle, so sharp recovery is not overly surprising.
One could read a lot into the sharp price divergence between the major indices yesterday (an “accumulation day” in the S&P 500, but “distribution day” in the Nasdaq), but doing so may be frivolous because we believe the unusual price action was primarily the result of end-of-year positioning among banks, mutual funds, hedge funds, and other institutions.
Since volume in the stock market usually dries up substantially starting the week before Christmas holiday, there is really only just over one week of active trading left this year. As such, our general plan right now is to simply focus on managing existing positions for minimum risk and maximum profitability, rather than aggressively looking for new swing trades to enter at this time. As we regularly remind subscribers, overtrading in a choppy or indecisive market is a surefire way to churn one’s trading account.
stock commentary:
Per yesterday’s plan, we closed $ALJ and $PXRL on Wednesday’s open. $ALJ broke down below the 50-day MA on heavier volume, so our call to exit on the open worked out well (exit price was 13.75). Although we are out of $PRXL, we liked the action on Wednesday and will continue to monitor for an entry point.
The market action over the past two weeks has been frustrating, with many leadership stocks stalling at breakout levels or breaking out and failing to hold on to gains. While the long side has not impressed, the market has yet to fall apart, which has equally frustrated the bears. Adding a little more uncertainty to the picture was yesterday’s divergence in the two big averages we follow. The lower close on higher volume in the Nasdaq produced a second straight day of distribution, while the S&P 500 closed in positive territory with a bullish reversal bar.
There is basically only one more week of trading left in the market for the year, as total volume usually tapers off after the second week of December and the action slows down quite a bit. Due to the lack of follow through in open positions and recent distribution in the Nasdaq, we feel its best to lay low for a few days (or more) and see how the action unfolds. We have moved the stops in current open positions to break-even due to the lack of confidence in the market. If they take off great, if they pull back in no harm done. If you are just signing up for our newsletter now and wondering why our picks are not working out it is because the market is not healthy. This is why we test the market with reduced share size when a new buy signal is generated.
If you are a new subscriber, please e-mail [email protected] with any questions regarding our trading strategy, money management, or how to make the most out of this report.
relative strength combo watchlist:
Our Relative Strength Combo Watchlist makes it easy for subscribers to import data into their own scanning software, such as Tradestation, Interactive Brokers, and TC2000. This list is comprised of the strongest stocks (technically and fundamentally) in the market over the past six to 12 months. The scan is updated every Sunday, and this week’s RS Combo Watchlist can be downloaded by logging in to the Members Area of our web site.