Buy
– Signal generated on the close of April 30 (click here for more details)
today’s watchlist (potential trade entries):

Having trouble seeing the open positions graphic above? Click here to view it directly on your web browser instead.
open positions:
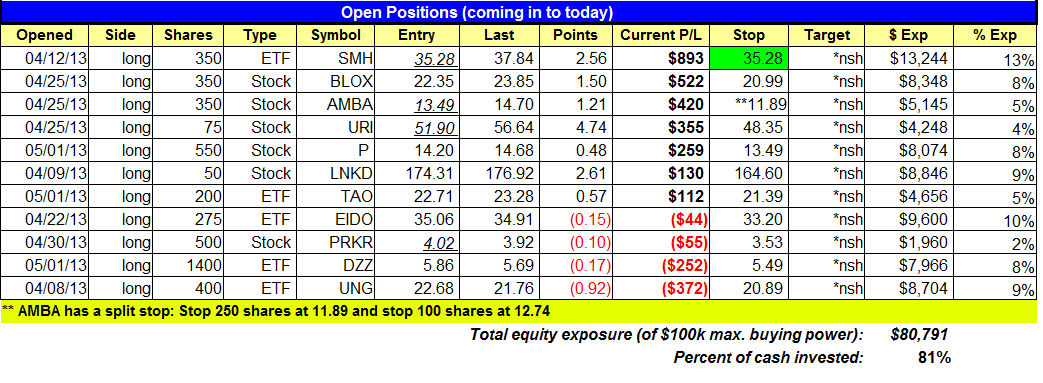
Below is an overview of all open positions, as well as a report on all positions that were closed only since the previous day’s newsletter. Net P/L figures are based a $100,000 model portfolio. Changes to open positions since the previous report are listed in pink shaded cells below. Be sure to read the Wagner Daily subscriber guide for important, automatic rules on trade entries and exits.
 Having trouble seeing the open positions graphic above? Click here to view it directly on your web browser instead.
closed positions:

Having trouble seeing the closed positions graphic above? Click here to view it directly on your web browser instead.
ETF position notes:
- Raised stop in $SMH.
stock position notes:
- No trades were made.
ETF, stock, and broad market commentary:
Stocks followed through on last Friday’s gap up, with modest gains in 4 out of the 5 major averages we follow (the Dow was the lone holdout, down -0.3%). Turnover decreased on both exchanges, preventing the averages from logging a bullish accumulation day. However, with all broad based averages now trading a new highs for the year, accumulation days are not nearly as significant as avoiding distribution. Simply put, after a rally builds enough momentum, light volume up days do not matter as much as big volume down days.
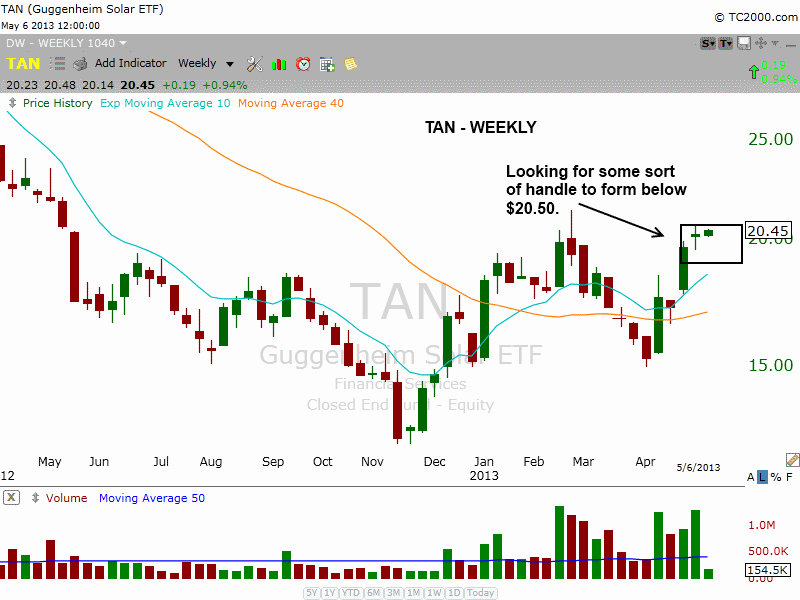
Claymore/MAC Global Solar Index ($TAN) is in the process of forming the “right side” of the base. Looking at the weekly chart below, we see that the price action has reversed higher off support at $15, on big volume.
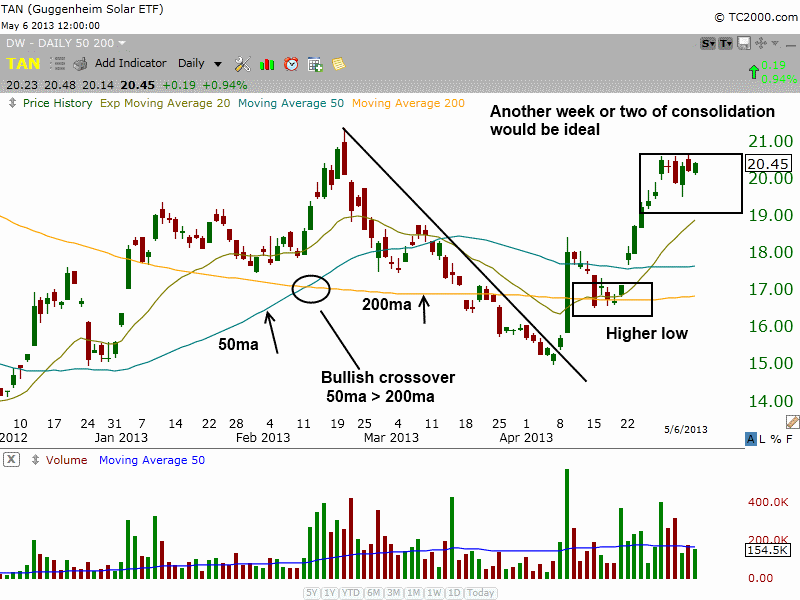
On the daily chart, we see that there was a bullish crossover signal with the 50-day MA crossing above the 200-day MA back in February. After breaking the downtrend line of the base in early April, $TAN rallied back above the 200 and 50-day MAs, and is now trading in a tight range just below the base high. Ideally, we’d love to see a few more weeks of basing action before $TAN hits new highs. This basing action is known as a handle, which should drift lower and have a few shakeout days.
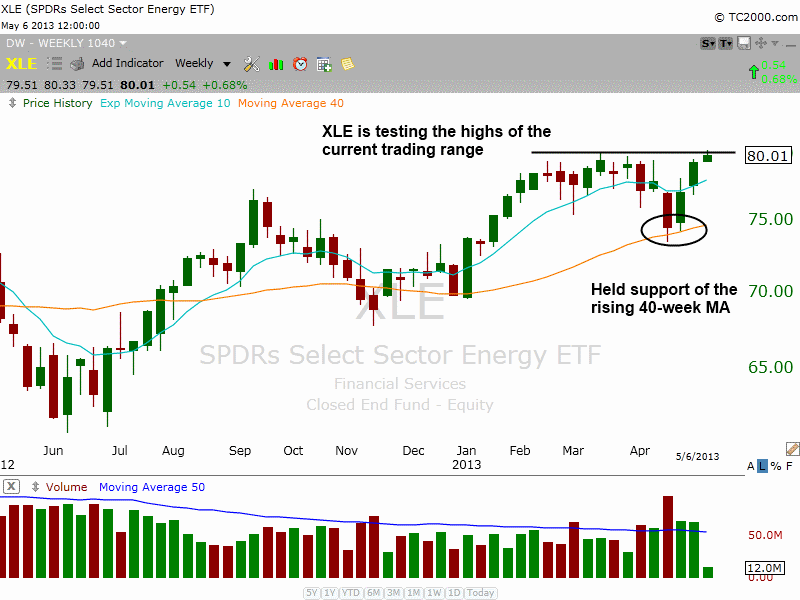
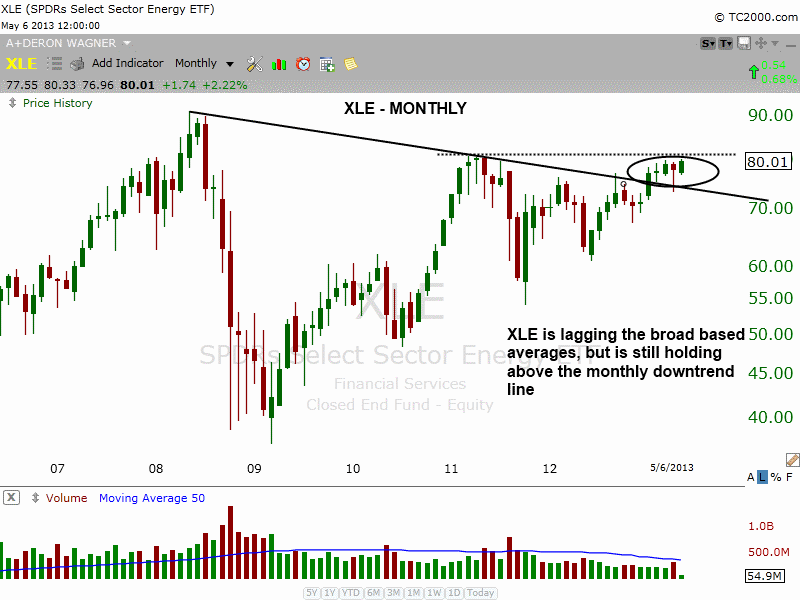
In mid-April, energy stocks were hit hard along with the commodity itself ($USO). However, since finding support at the 40-week MA, Energy Select Sector SPDR ($XLE) has reversed sharply to the highs of the range. We are not looking to buy $XLE, as it has lagged the broad market averages for quite some time, but the fact that the price action did not roll over is a good sign.
The monthly chart shows the price action holding above the monthly downtrend line breakout. $XLE is clearly not leading the market, but as the price action strengthens, it could possibly become a leader during the next rally.
$AMBA is starting to heat up, as it rallied 5% on big volume yesterday. $URI is also in good shape with two big volume up days in a row. Look for $PRKR to explode higher IF it can close above $4.
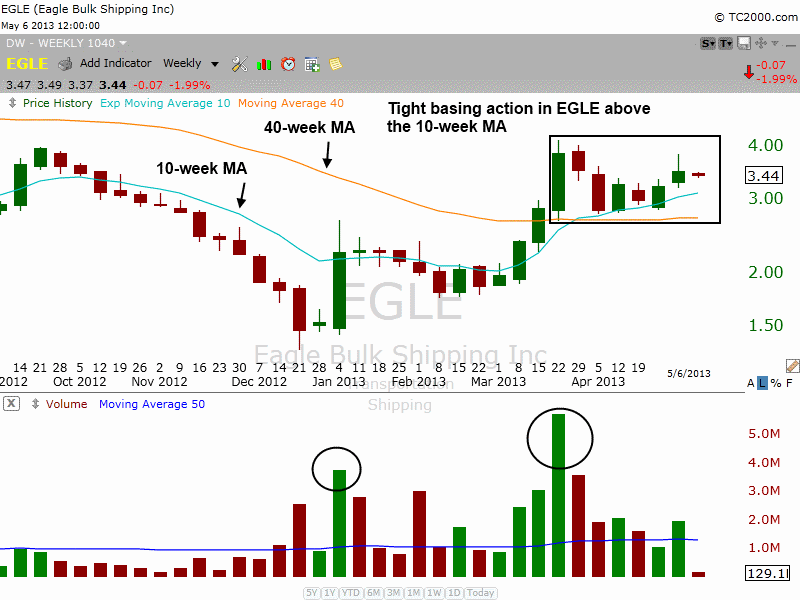
$EGLE is not an official buy setup because it reports earnings on May 8, but it is a great example of what we look for in big volume setups.
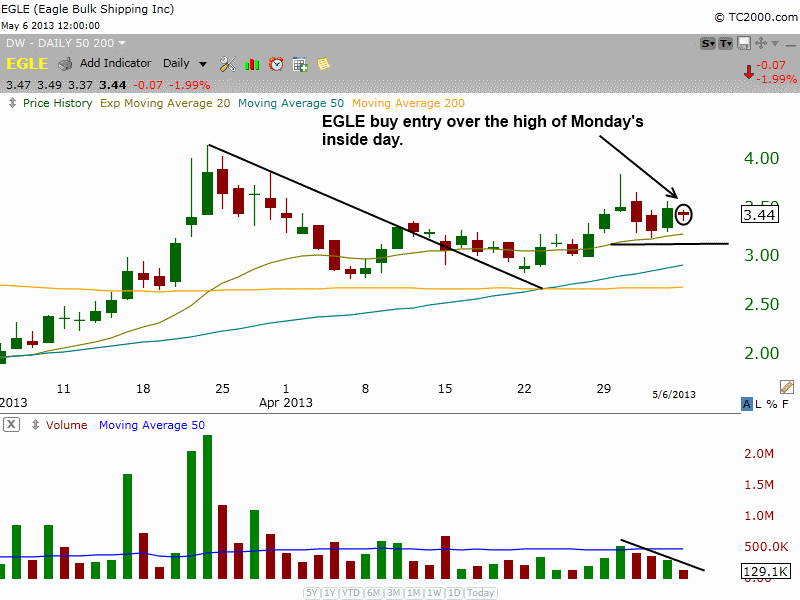
The daily chart details the unoffcial buy entry, which is over yesterday’s tight, inside day. These smaller, explosive stocks tend to have great reward to risk ratios, so one can risk $200 and potentially make $800-$1000 in 3 to 10 days.
Again, just to be clear, $EGLE is not an official buy entry due to earnings on May 8.
relative strength combo watchlist:
Our Relative Strength Combo Watchlist makes it easy for subscribers to import data into their own scanning software, such as Tradestation, Interactive Brokers, and TC2000. This list is comprised of the strongest stocks (technically and fundamentally) in the market over the past six to 12 months. The scan is updated every Sunday, and this week’s RS Combo Watchlist can be downloaded by logging in to the Members Area of our web site.