Buy– Signal generated on the close of December 31 (click here for more details)
today’s watchlist (potential trade entries):

Having trouble seeing the open positions graphic above? Click here to view it directly on your web browser instead.
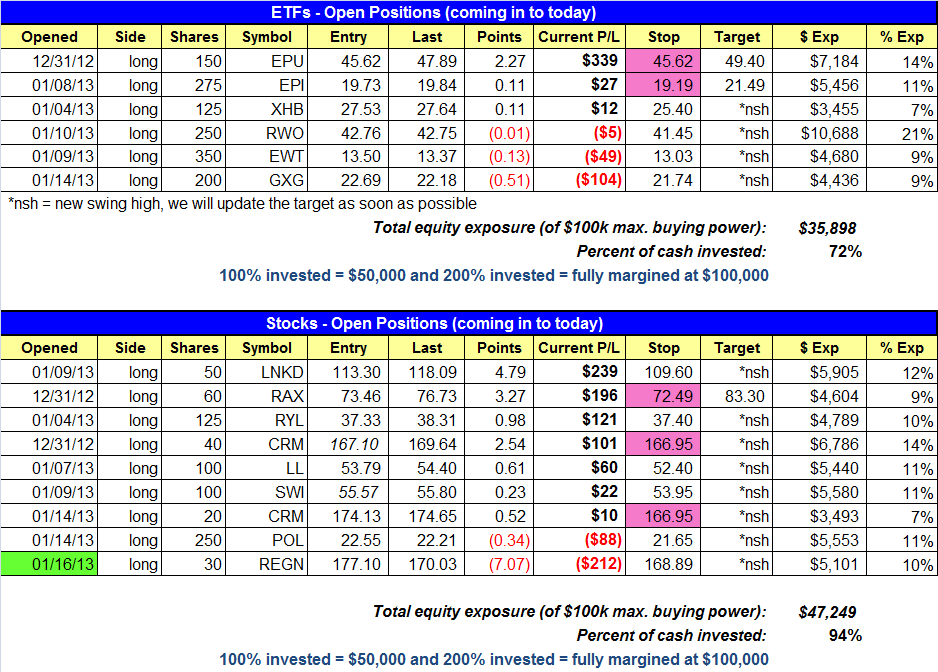
open positions:
Below is an overview of all open positions, as well as a report on all positions that were closed only since the previous day’s newsletter. Net P/L figures are based on two separate $50,000 model portfolios (one for ETFs and one for stocks). Changes to open positions since the previous report are listed in pink shaded cells below. Be sure to read the Wagner Daily subscriber guide for important, automatic rules on trade entries and exits.
Having trouble seeing the open positions graphic above? Click here to view it directly on your web browser instead.
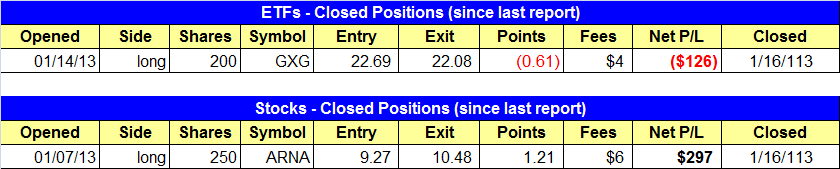
closed positions:
Having trouble seeing the closed positions graphic above? Click here to view it directly on your web browser instead.
ETF position notes:
- $GXG sell stop triggered for 200 shares.
stock position notes:
- Sold ARAN on sell stop, locking a 13% gain.
ETF, stock, and broad market commentary:
The broad based averages continue to chop around in a tight range with buyers stepping in on intraday dips, but there has not been enough momentum to generate much follow through the next day. The daily chart of the S&P 500 pretty much sums up the action, with four days in a row of little to no fluctuation in the closing price.
Turnover was mixed, with total volume falling 9% off Tuesday’s pace in the Nasdaq but increasing by less than 1% on the NYSE. The higher volume on the NYSE did not lead to a distribution day for the S&P 500 because it closed in positive territory.
Although the major averages have failed to follow through on the January 2 gap up, we have yet to see any clear cut distribution enter the market. Our market timing model remains on a buy signal. With no distribution on board, we must continue to operate with a bullish bias and give open positions enough breathing room and not be in such a rush to raise our stops.
IMPORTANT NOTE:
As of Thursday, January 17, we will be using the 5-minute rule for all entries and exits in the Wagner Daily ETF and stock model portfolios. By waiting until 5 minutes after the stock market opens before buying anything that triggers on the open, we can prevent rogue trades, well outside of market prices, from falsely triggering our stop prices.
Entries under the 5-minute rule: No trades go live until 5 minutes after the stock market opens. So if the price action trades through our buy stop within the first 5-minutes of trading we do nothing and simply wait for 5-minutes. At 9:35 we mark the 5-minute high and add 10 cents to the 5-minute high as the new official entry point. As long as the 5-minute high is not more than 1.3% above the original trigger point the setup is still valid. If the 5-minute high (not adding the 10 cents) is more than 1.3% above our trigger, the trade is automatically canceled.
Exits under the 5-minute rule: No stops go live until after 5-minutes of trading. If the price action trades through our stop within the first 5-minutes of trading we do nothing and wait for 5-minutes. At 9:35 am we set a new stop 10 cents below the 5-minute low.
How to handle a morning gap up above our trigger: If the morning gap up is more than 1.3% above our entry the trade is automatically canceled. If the gap up is less than or equal to 1.3% we wait for 5-minutes to pass and then set a buy stop 10 cents above the 5-minute high, provided that the 5-minute high is not more than 1.3% above the original trigger.
How to handle a morning gap down below our stop: If the morning gap down is more than 1.3% below our stop the position is to be sold right away ( do not wait for 5-minutes). If the gap down is less than 1.3% below the stop, then wait for the 5-minute low to form and place a new stop 10 cents below the 5-minute low.
For those who are active traders, we advise opening a secondary account with a firm that allows conditional orders such as Interactive Brokers or Tradestation.
Although we are officially using the 5-minute rule for all entries and exits, our trend trading system is still based on end of day quotes, so no part of the system has changed. Those who are unable to implement the 5-minute rule should continue to operate as we have in the past, buying and selling stocks on the open. We will continue to support and monitor these trades and advise subscribers of what action to take and we will continue to send alerts via email and text to confirm trades.
The weekly chart of the SPDR KBW Bank ($KBE) shows a tightening of the price action since March of last year. Note how the distance from each swing high to swing low tightened up. This is the type of action that we look for in all consolidations, regardless if it is a weekly, daily, or intraday chart. The recent breakout above $24.75 is a buy signal.

Dropping down to the daily chart, we see the gap up on Jan. 2 that eventually led to the breakout above the highs of the consolidation. Like the broad market averages, $KBE has failed to extend much beyond the breakout level, however; the price action has once again tightened up nicely on the daily chart while holding above the 24.75 breakout pivot. The buy stop in $KBE is simply over the highs of the current range. Our stop is placed well below the 20-day EMA, which is catching up to the price and should provide support on any intraday shakeout below support at 24.50. Trade details can be found in the watchlist section above.

We have updated the stops in $EPU and $EPI. Both stops are placed below the rising 20-day EMA, which should now act as support. New breakouts should hold support at the 20-day EMA and resume their uptrend shortly thereafter. We canceled the $IBB buy setup for today but will continue to monitor the action for a potential pullback entry.
On the stock side we have one new setup listed in $MDVN. Like the weekly chart of $KBE, $MDVN’s price action has really tightened up the past few months:

The buy entry is just above 55.00, which if we timed it right could lead to an explosive breakout to new highs in a few days.
We locked in a 13% move in $ARNA as it triggered our sell stop at 10.49. Yesterday’s ugly selloff and undercut of the 20-day EMA in $CRM provides us with a clear stop. We do not want to be in if the price action dips back below Wednesday’s low. We raised the stop in $RAX, but rather than going tight we went with a stop below the 20-day EMA. Our thinking is that the market has yet to print a clear distribution day, so we should let setups develop. We will tighten up stops when it makes sense to do so, but we can’t choke these trades off when conditions are good.
If you are a new subscriber, please e-mail [email protected] with any questions regarding our trading strategy, money management, or how to make the most out of this report.
relative strength combo watchlist:
Our Relative Strength Combo Watchlist makes it easy for subscribers to import data into their own scanning software, such as Tradestation, Interactive Brokers, and TC2000. This list is comprised of the strongest stocks (technically and fundamentally) in the market over the past six to 12 months. The scan is updated every Sunday, and this week’s RS Combo Watchlist can be downloaded by logging in to the Members Area of our web site.