market timing model:
Neutral – Signal generated on the close of December 13 (click here for more details)
today’s watchlist (potential trade entries):

Having trouble seeing the open positions graphic above? Click here to view it directly on your web browser instead.
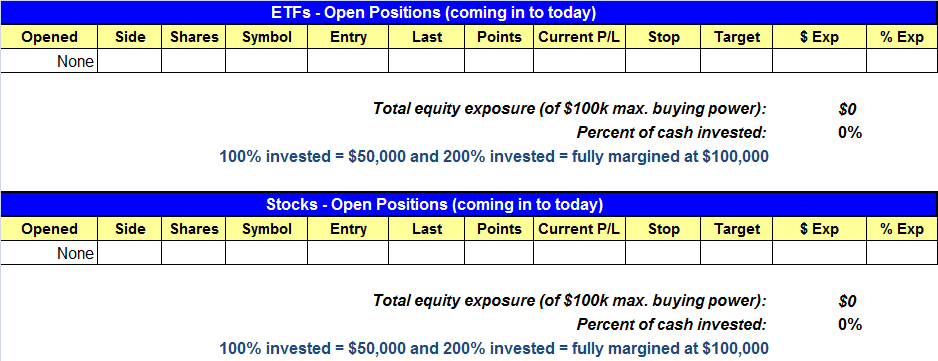
open positions:
Below is an overview of all open positions, as well as a report on all positions that were closed only since the previous day’s newsletter. Net P/L figures are based on two separate $50,000 model portfolios (one for ETFs and one for stocks). Changes to open positions since the previous report are listed in pink shaded cells below. Be sure to read the Wagner Daily subscriber guide for important, automatic rules on trade entries and exits.
Having trouble seeing the open positions graphic above? Click here to view it directly on your web browser instead.
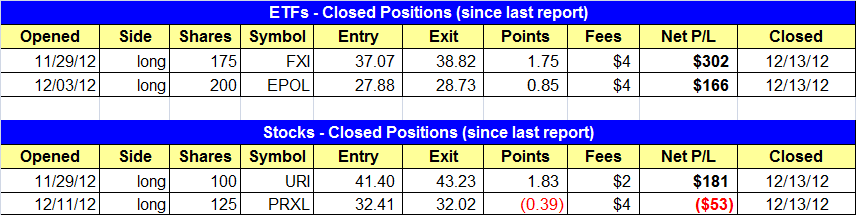
closed positions:
Having trouble seeing the closed positions graphic above? Click here to view it directly on your web browser instead.
ETF position notes:
- $IBB back on watchlist with a sell limit order to go short. We are keeping the dollar risk the same as the last trade.
- Sold $FXI and $EPOL to lock in gains.
stock position notes:
- Sold $URI for a small gain and sold $URI for a scratch loss.
ETF and broad market commentary:
Following through on bearish momentum from the previous day’s weakness, stocks registered another round of broad-based losses yesterday. The S&P 500, Nasdaq Composite, Dow Jones Industrial Average, and small-cap Russell 2000 each fell an average of 0.63%. The S&P Midcap 400 Index showed relative weakness by sliding 0.9%. Total volume in the Nasdaq was 5% higher than the previous day’s level, causing the index to suffer a bearish “distribution day” that was indicative of selling amongst banks, mutual funds, hedge funds, and other institutions. However, lighter volume in the NYSE enabled the S&P 500 to dodge the same negative label.
Below is a longer-term weekly chart pattern of S&P 500 SPDR ($SPY), a popular ETF proxy for trading the benchmark S&P 500 Index. Notice that $SPY will likely print a bearish “shooting star” candlestick pattern for the week. This is a topping pattern that often indicates near-term bullish momentum is running out. Since a weekly chart is a longer-term interval than a daily chart, the formation of this shooting star pattern on the weekly chart is more important than if the the same pattern occurred on a daily chart:

Notice that the formation of the shooting star candlestick also occurred as $SPY “overcut” resistance of its downtrend line from the September high. This overcut of the downtrend line is significant because it sucks in new buyers, just as institutions are starting to sell into strength. This creates additional overhead supply that subsequently increases the odds of a resumption of the dominant downtrend. This would be confirmed if $SPY breaks below the horizontal price support shown above, which is merely a move below the low of its current weekly candlestick.
Although the weekly pattern of $SPY looks a bit ominous, at least in still trading above technical support of its 20, 50, and 200-day moving averages on the shorter-term daily chart. That’s more than one can say about the Nasdaq 100 Index, which sliced back below its 50 and 200 day moving averages yesterday. As you can see on the daily chart of $QQQ (an ETF proxy that tracks the Nasdaq 100), a break below yesterday’s low would coincide to the Nasdaq sliding back below its 20-day exponential moving average as well:

We concluded yesterday’s technical commentary by saying, “Given the lack of explosive price action in leadership stocks and the late day selling in the averages the past two days, the market could be vulnerable to a sell off in the short term…We are not calling the current rally dead, but we do not mind stepping aside for a few days and monitoring the price action.” To coincide with this statement, we made a judgment call to take profits on all long positions in our model portfolio by selling at market on yesterday’s open. Given that the broad market subsequently trended lower throughout the entire session, this worked out pretty well. Now, we are back to “flat and happy,” sitting on the sidelines 100% in cash.
Notice that our stock market timing model has shifted from “buy” to “neutral” mode today. This means we have no firm bias with regard to near to intermediate-term market trend. The lack of substantial bullish follow-through in leading individual stocks, the absence of leadership in most ETFs (other than international ETFs), and the bearish pattern on the weekly chart of $SPY are all valid reasons to avoid the long side of the market now. Nevertheless, the price action in the stock market has not yet convincingly confirmed the balance of power has shifted back to the bears, so we are a bit cautious about aggressively jumping in the short side of the market just yet.
One big challenge for swing traders right now is that volume levels in the broad market will likely begin heavily receding next week, as we approach the Christmas holiday. As we have warned several times in recent weeks, swing trading in low-volume environments is challenging because day-to-day price action tends to be more erratic and indecisive. Therefore, we’re not in a hurry to enter multiple new positions (either long or short) ahead of the holidays, but will still consider new stock and/or ETF trade entries (possibly on the short side and/or inverse ETFs) with reduced share size if an ideal trade setup with a firmly positive reward-risk ratio presents itself. We do have one new setup on today’s watchlist in $IBB. We stopped out of $IBB a few days ago but we are looking to re-enter on a slight bounce. See today’s watchlist for trade details.
stock commentary:
We sold open long positions on the open due to the lack of follow through in breakouts and genearal “blah” price action in the market since our timing model moved to a buy signal on Nov. 23. We are now 100% in cash and that may not be a bad place to be for a while. That being said, if the market continues to deteriorate we may add some short exposure if quality setups emerge.
$VRSN, $TSCO, $BIDU, and $ALXN are potential short setups for aggressive traders. Other stocks such as $CMG may need a few more weeks to produce low risk entry points on the short side. A high volume break of the 50-day MA followed by a 3-5 day bounce into resistance would be ideal.

If you are a new subscriber, please e-mail [email protected] with any questions regarding our trading strategy, money management, or how to make the most out of this report.
relative strength combo watchlist:
Our Relative Strength Combo Watchlist makes it easy for subscribers to import data into their own scanning software, such as Tradestation, Interactive Brokers, and TC2000. This list is comprised of the strongest stocks (technically and fundamentally) in the market over the past six to 12 months. The scan is updated every Sunday, and this week’s RS Combo Watchlist can be downloaded by logging in to the Members Area of our web site.