Confirmed Buy
– The timing model was upgraded to a confirmed buy on the close of January 22. However, the initial buy signal was generated on the close of December 31. (click here for more details)
today’s watchlist (potential trade entries):

Having trouble seeing the open positions graphic above? Click here to view it directly on your web browser instead.
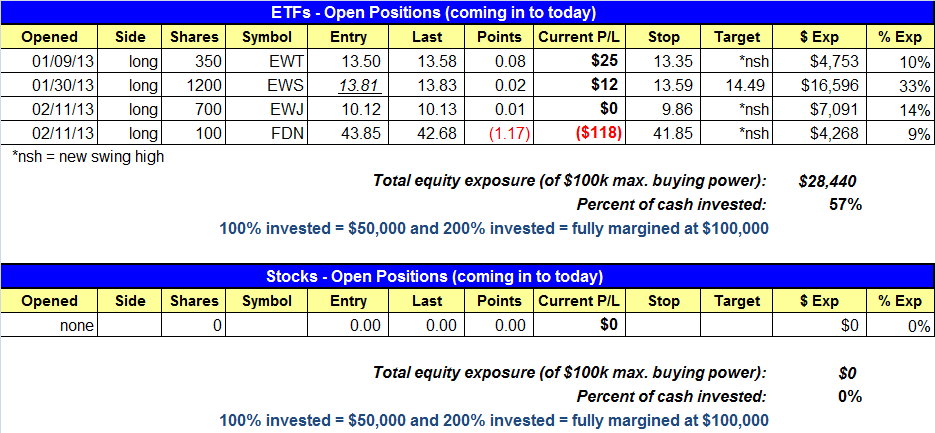
open positions:
Below is an overview of all open positions, as well as a report on all positions that were closed only since the previous day’s newsletter. Net P/L figures are based on two separate $50,000 model portfolios (one for ETFs and one for stocks). Changes to open positions since the previous report are listed in pink shaded cells below. Be sure to read the Wagner Daily subscriber guide for important, automatic rules on trade entries and exits.
Having trouble seeing the open positions graphic above? Click here to view it directly on your web browser instead.
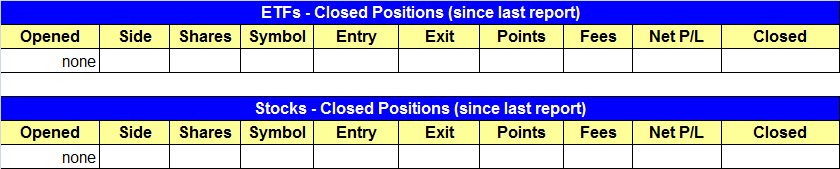
closed positions:
Having trouble seeing the closed positions graphic above? Click here to view it directly on your web browser instead.
ETF position notes:
- No trades were made.
stock position notes:
- No trades were made.
ETF, stock, and broad market commentary:
Stocks bounced back on Friday, with all major averages posting gains of at least +0.9%. However, volume was significantly lighter across the board, signaling a lack of buying interest amongst banks, mutual funds, hedge funds, and other institutions. Last week’s back to back distribution days in the S&P 500 is a clear warning sign for the bulls. The market really is not dead, but one or two more distribution days this week to early next would more than likely end the rally and generate a sell signal in our market timing model.
How will the market act this week? Will the S&P 500 and Nasdaq recover and clear prior swing highs on heavy volume, or stall out after a light volume bounce and roll over? We do not know. As always, we operate with no crystal ball and prefer to react to price and volume action rather than attempt to predict.
After leading the market higher in 2011 and much of 2012, iShares NASDAQ Biotechnology Index ($IBB) has spent the past few months digesting gains and building a new base off the 200-day MA. The past few weeks have been very quiet, with the price action forming a tight range near the highs of the base.

Money rotated out of $IBB in Q4-2012, but the price action has recovered nicely and this sector could be back in play soon. A breakout above 148.00 on the weekly chart would signal that the next advance is under way. We might be able to establish a small position before the obvious breakout level if the price action forms a higher swing low. However, with the market rally losing steam we are in no rush to establish new positions.
In case the market does break down, we ran a relative weakness scan over the weekend to identify groups/sectors that have under performed during the past 6 months. There isn’t much out there in terms of clear cut shorts within industry groups, as most of groups are in line with the S&P 500. Gold & gold stocks especially have taken a beating as of late; however, if market conditions weaken, then we could see some buying interest in gold.
SPDR S&P Metals and Mining ($XME) has also been weak, failing to rally with the market over the past few months. The weekly chart below details XME’s divergence:

$XME does have exposure to gold, but the majority of its exposure is to steel, which has not been acting well and broke down below the 50-day MA last week (check out steel ETF – $SLX). $XME is currently not actionable, but we will continue to monitor the action for a low risk entry point on the short side if the market breaks down.
On the stock side, we did not see many actionable buy points as most stocks are extended or at the very least in need of a week or two to produce quality buy points. Some charts have held up well. $SCTY, $FSLR, $NFLX, $GMCR, and $FIVE are a few examples.

$FIVE has tightened up quite a bit the past few weeks and is buyable above the high of 2/5 (this is not an official setup). Note the higher swing lows within the base and the tight price action over the past three weeks. The only issue with this setup at this point is that market conditions are weakening, which means that share size should probably be reduced to half size or less for those who take the trade (if it triggers).
We plan to lay low for a few days and see how the market reacts to last week’s selling.
If you are just now subscribing to our newsletter or have been on board for a week or two, you have seen how we operate in buy mode with full exposure and several positions. If the market suffers one or two more distribution days, our timing model will most likely shift to sell mode. This means that there may not be as many trade ideas, as the market digests the recent rally. Please realize that in order to be a successful trader you do not have to trade every swing in the market, which is why we shy away from calling tops or bottoms (these trades are ego based, with little to no reason for entry). Sometimes cash is king!
If you are a new subscriber, please e-mail [email protected] with any questions regarding our trading strategy, money management, or how to make the most out of this report.
relative strength combo watchlist:
Our Relative Strength Combo Watchlist makes it easy for subscribers to import data into their own scanning software, such as Tradestation, Interactive Brokers, and TC2000. This list is comprised of the strongest stocks (technically and fundamentally) in the market over the past six to 12 months. The scan is updated every Sunday, and this week’s RS Combo Watchlist can be downloaded by logging in to the Members Area of our web site.