market timing model:
SELL – Signal generated on the close of July 10 (click here for more details)
today’s watchlist (potential trade entries):

open positions:
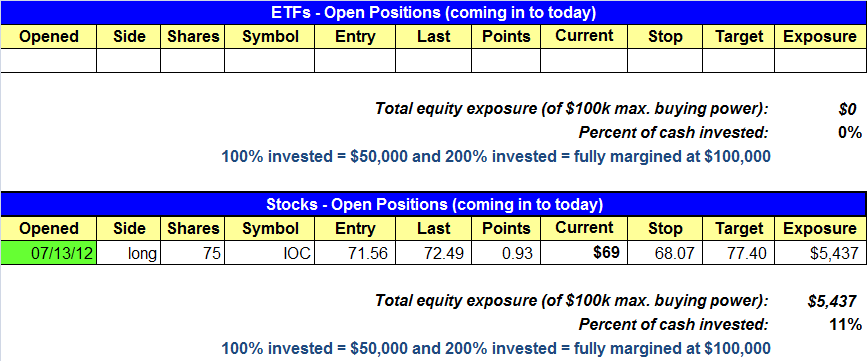
Below is an overview of all open positions, as well as a report on all positions that were closed only since the previous day’s newsletter. Net P/L figures are based on two separate $50,000 model portfolios (one for ETFs and one for stocks). Changes to open positions since the previous report are listed in red shaded cells below. Be sure to read the Wagner Daily subscriber guide for important, automatic rules on trade entries and exits.

Having trouble seeing the open positions graphic above? Click here to view it directly on your web browser instead.
closed positions:

Having trouble seeing the closed positions graphic above? Click here to view it directly on your web browser instead.
ETF position notes:
- Closed VWO short position on the open for small loss.
stock position notes:
- IOC long setup triggered.
ETF and broad market commentary:
Stocks jumped higher on Friday, as trade declined. Although the rally lacked volume, all five major indices closed near session highs. The rally was broad based. Both the Dow Jones Industrial Average and the S&P 500 rallied 1.6%, while the Nasdaq and the S&P MidCap 400 tacked on 1.5%. The small-cap Russell 2000 trailed the other indices slightly, but still added an impressive 1.4%.
Internals ended the session mixed on Friday. Volume slipped on the Nasdaq by 20.9% on the Nasdaq and 12.6% on the NYSE. However, advancing volume topped declining volume on the NYSE by a factor of 8.1 to 1 and on the Nasdaq by a factor of 2.9 to 1.
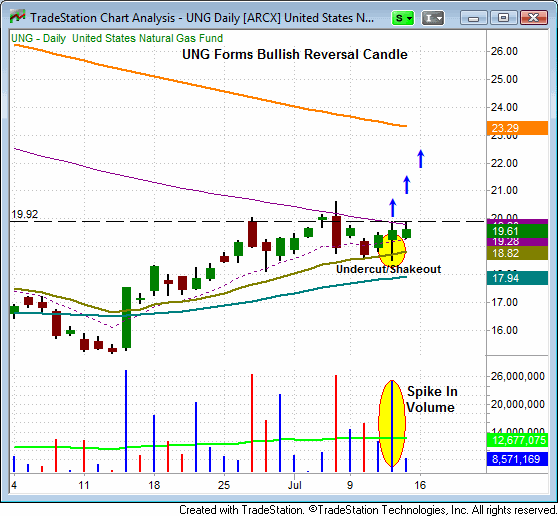
Last Thursday, on a burst of volume, the United States Natural Gas Fund (UNG) formed a bullish reversal candle, as it undercut its 20-day EMA and reversed to close near session highs. This type of price action serves to “shake weak hands out of the trade” and sweep poorly placed stops. We recently exited UNG at breakeven because we didn’t like the price action in the broad market. Since then however, UNG has continued to consolidate above support of its 20-day EMA and now appears ready for a push higher. It is important to remember that every trade stands of its own merits. There is nothing wrong with re-entering a trade if it meets the appropriate criteria. In fact, it would be a poor trading practice to not enter a trade if a legitimate setup triggered. This should not be confused with “revenge trading,” which is the practice of re-establishing a position without a legitimate trigger, in an emotional attempt to prove the market wrong. We are placing UNG on the watchlist. Trade details are available to our clients in the watchlist section of the newsletter.

Price action was quite good on Friday but the lack of volume took some of the shine off the rally. Volume tells us how committed institutions are to the prevailing move. Healthy price action in the absence of volume generally suggests that retail, and not institutions, are driving the price action. Institutional presence is mandatory for the market to maintain a significant trend.
stock commentary:
IOC triggered its buy entry on Friday with a pick up in volume but still well below the 50-day volume average. We’d like to see the price action hold Friday’s low, but for now there is no change in the stop price.
Our weekend scans produced a few decent setups but each had as issue (or two) and failed to make the official watchlist. Most setups were either reporting earnings within a week or two or not top quality. With the market still on a sell signal we are in no rush to add long exposure. For the market to stage a meaningful rally we eventually have to see quality stocks breaking out to new highs in numbers. The plan is to remain patient until this happens so that the odds are stacked in our favor.
If you are a new subscriber, please e-mail [email protected] with any questions regarding our trading strategy, money management, or how to make the most out of this report.
relative strength watchlist:
Our Relative Strength (or RS) Watchlist makes it easy for subscribers to import data into their own scanning software, such as Tradestation, Interactive Brokers, and TC2000. This list is comprised of the strongest 100 (or so) stocks in the market over the past six to 12 months. The scan is updated every Sunday, and this week’s RS Watchlist can be downloaded by logging in to the Members Area of our web site.