Confirmed Buy– The timing model was upgraded to a confirmed buy on the close of January 22. However, the initial buy signal was generated on the close of December 31. (click here for more details)
today’s watchlist (potential trade entries):

Having trouble seeing the open positions graphic above? Click here to view it directly on your web browser instead.
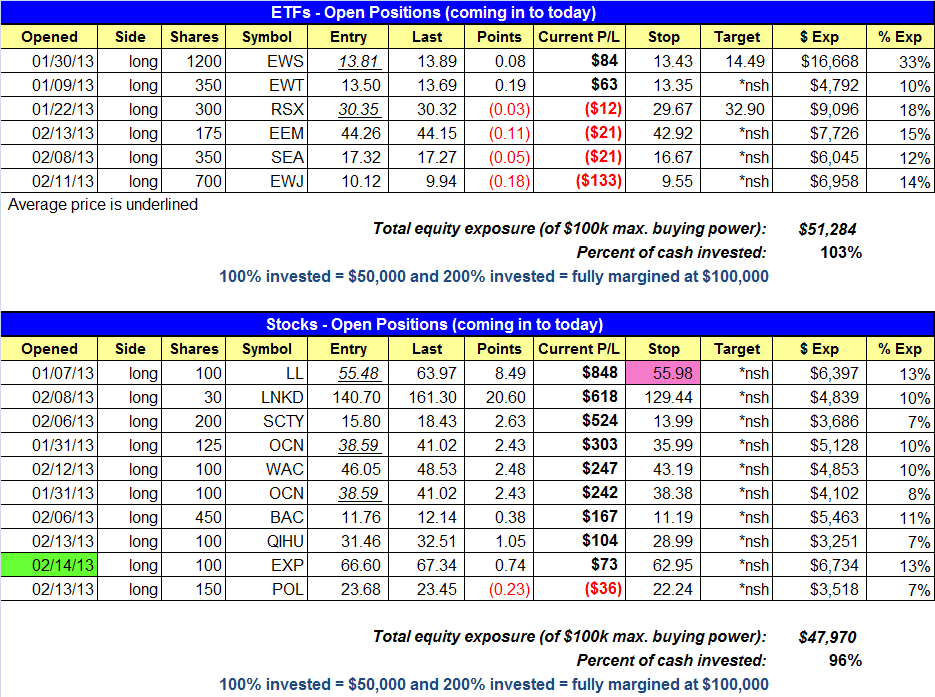
open positions:
Below is an overview of all open positions, as well as a report on all positions that were closed only since the previous day’s newsletter. Net P/L figures are based on two separate $50,000 model portfolios (one for ETFs and one for stocks). Changes to open positions since the previous report are listed in pink shaded cells below. Be sure to read the Wagner Daily subscriber guide for important, automatic rules on trade entries and exits.
Having trouble seeing the open positions graphic above? Click here to view it directly on your web browser instead.
closed positions:
Having trouble seeing the closed positions graphic above? Click here to view it directly on your web browser instead.
ETF position notes:
- No trades were made.
stock position notes:
- $EXP buy setup triggered.
ETF, stock, and broad market commentary:
After gapping slightly lower on yesterday’s open, stocks quickly reversed their initial weakness. By midday, all the main stock market indexes had recovered back to the flat line. Thereafter, the broad market traded mostly sideways into the close. The S&P 500, Nasdaq Composite, and Dow Jones Industrial Average all finished within 0.1% of unchanged levels. However, the small-cap Russell 2000 and S&P Midcap 400 indices continued to show relative strength and closed in positive territory. Total volume in both the NYSE and NASDAQ was 6% higher than the previous day’s levels.
The iShares Dow Jones US Home Construction ($ITB) broke out from a bullish base on January 2, and rallied about 10% higher before stalling out just below 24.00. After a two-week pullback off the highs, $ITB rallied sharply off support of the 20-day EMA but stalled once again just below 24.00.

Stocks/ETFs that find support at the 20-day EMA within a strong uptrend do not always break out to new highs immediately on the next move out. Sometimes they may need another week or two of consolidation before resuming the uptrend. As long as $ITB continues to set higher lows while consolidating, then the action is bullish. If $ITB stalls out at the range highs and pulls back in, then we may be able to grab a low-risk pullback entry off the 20-day EMA, around the 22.75 to 23.00 level.
After a 25% rally off the lows last summer, the United States Oil Fund ($USO) has formed a bullish base over the past five months. $USO reclaimed its 50-day MA in late December, breaking above the short term downtrend line. Over the past several weeks it has set higher swing highs and lows before stalling out around 35.50.

When a stock/ETF emerges off the lows of a basing pattern, it begins to form the “right side” of the pattern. The left side is the decline off the highs, with a series of lower highs and lower lows and the price action trending lower below the 50-day MA. Once the price bottoms out for several weeks and is finally able to set a higher swing low, the right side of the base forms, which usually leads to a series of higher highs and lows above the 50-day MA. As we see on the daily chart above, $USO is building momentum, with the 50-day MA now in an uptrend and crossing above the 200-day MA. Ideally, the price action should trade around the 34.30 to 35.50 area for another week or two before breaking out. We will continue to monitor the action for a reliable entry point.
On the stock side, we added one new position to the portfolio in $EXP yesterday, which closed above the breakout pivot on higher than average volume. We are looking for a 15-20% move over the next 3-6 weeks as a target.
With small and mid-cap stocks having a tough year in 2012, it was easy to forget how explosive these stocks can be when conditions are ideal. So far in 2013, small and mid-caps stocks have led the market higher, which is a good sign for our style of trading.
When conditions are ideal and there is minimal distribution in the major averages, the idea is to let our stocks do the work for us. The entry is usually the easy part. The difficultly comes in managing a trade patiently, which is always easier said than done. Sometimes we make the mistake of giving in to the fear of the market pulling back just because it is extended in the short-term.
Giving in to this fear that the market will pull back usually gets leads bad decision making, and it did so for us in early February, as we decided to raise our stop in $LL to avoid a potential pullback or false breakout.

Although it felt good to raise the stop, there simply was no valid reason to do so (we can’t trade scared). Again, when conditions are strong and the market is not under heavy distribution, then we must let our stocks go. Rather than giving in to the fear, we should have left our stop in $LL alone until it broke out above 60.00, especially when we had such a good average price with our first entry basically off the 50-day MA.
Within a day or two of raising the stop, $LL pulled back in and stopped us out of 75 shares, leaving us with 100 shares. The very next day $LL bounced right back and eventually broke out to new swing highs. The pullback that we dreaded lasted all of one day. If conditions begin to deteriorate and distribution piles up, then cutting positions early or raising stops is usually a good idea. However, when everything is acting right, it’s best to let the price action tell us where to get out.
If you are a new subscriber, please e-mail [email protected] with any questions regarding our trading strategy, money management, or how to make the most out of this report.
relative strength combo watchlist:
Our Relative Strength Combo Watchlist makes it easy for subscribers to import data into their own scanning software, such as Tradestation, Interactive Brokers, and TC2000. This list is comprised of the strongest stocks (technically and fundamentally) in the market over the past six to 12 months. The scan is updated every Sunday, and this week’s RS Combo Watchlist can be downloaded by logging in to the Members Area of our web site.