Current buy signal was generated on the close of June 13
Past signals:
Neutral signal generated on close of June 12
Buy signal generated on the close of April 30
today’s watchlist (potential trade entries):

Having trouble seeing the open positions graphic above? Click here to view it directly on your web browser instead.
open positions:
Below is an overview of all open positions, as well as a report on all positions that were closed only since the previous day’s newsletter. Net P/L figures are based a $100,000 model portfolio. Changes to open positions since the previous report are listed in pink shaded cells below. Be sure to read the Wagner Daily subscriber guide for important, automatic rules on trade entries and exits.

Having trouble seeing the open positions graphic above? Click here to view it directly on your web browser instead.
closed positions:

Having trouble seeing the closed positions graphic above? Click here to view it directly on your web browser instead.
ETF position notes:
- No trades were made.
stock position notes:
- Sold 100 shares of $KORS and have 50 remaining.
ETF, stock, and broad market commentary:
Stocks failed to follow through on Thursday’s accumulation day and slid lower most of the session, with the broad based averages closing down in the -0.4 to -0.8% range. Although the market reversed on the session, turnover eased on both exchanges, which is a good sign. As mentioned in last Friday’s report, it is important for the averages to avoid distribution over the next few days.
After any corrective phase in the market there are a few things we look for to let us know that conditions are improving:
- The market must find some traction and set a higher swing low (A new uptrend can not form if the averages are making lower lows).
- NYSE and NASDAQ volume patterns must turn bullish (Multiple accumulation days with little to no distribution).
- Leading stocks must be forming bullish patterns.
If the answer to all the above is yes, then conditions are improving and a new bull market is potentially under way. However, the bull market can not be confirmed until leading stocks break out on solid price and volume action.
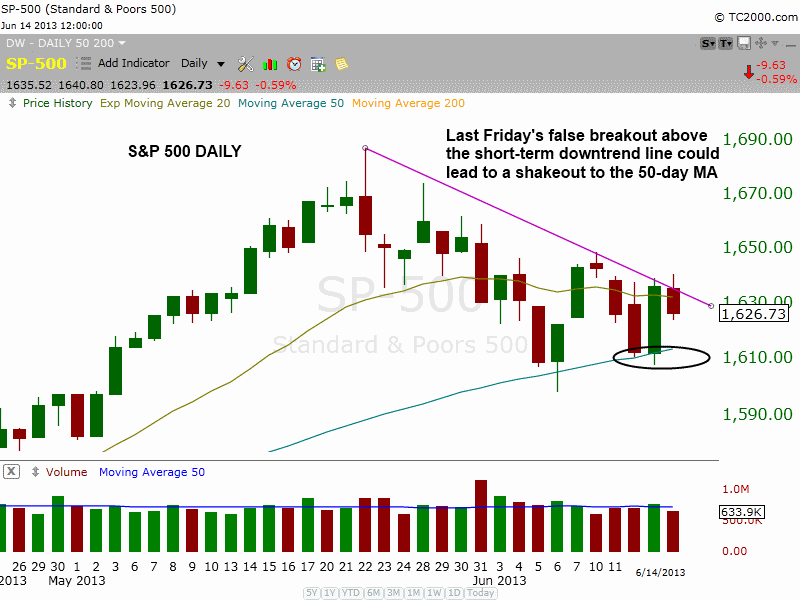
Yesterday’s false breakout above the downtrend line in the S&P 500 could spark a short-term pullback to the 50-day MA, and we could potentially see an undercut of last Thursday’s low. However, as long as the low of June 6 holds and the market avoids distribution (heavy selling), then the timing model will remain on a buy signal.

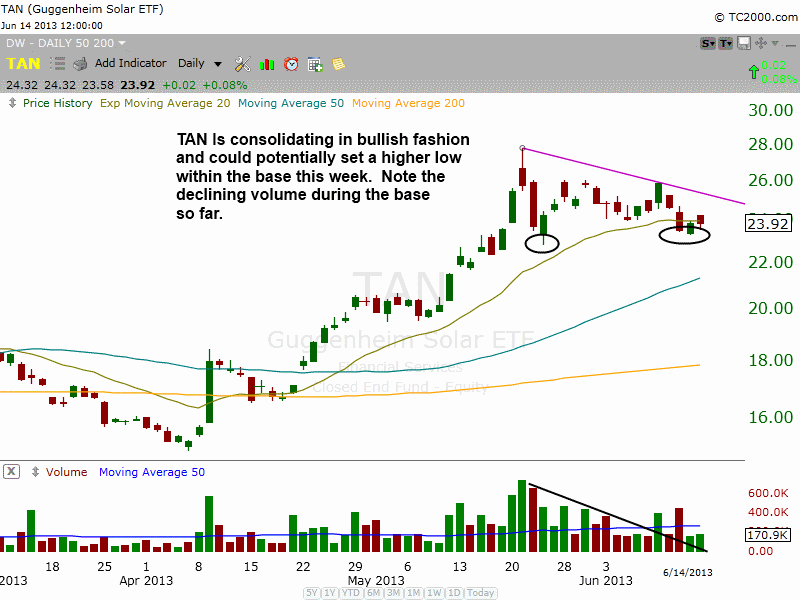
Guggenheim Solar ETF ($TAN), which is one of the top performing ETFs this year continues to impress, with a tight consolidation above the rising 20-day EMA. Last week’s dip below the 20-day EMA could create a higher swing low within the base, if the price action can recover and hold above $24 this week.

We are placing $TAN on the official watchlist with a buy entry over Friday’s high. This is just a starter position with reduced share size, as we plan to add to our position if $TAN can break the downtrend line of the current consolidation. The stop is placed just beneath the low of May 23, minus some wiggle room.
On the stock side, we have two new buy setups. We plan to add to our position in $AMBA on a pullback, so we are using a buy limit order placed at the 10-day MA. Please note that this is NOT a buy stop order, so the buy limit order will trigger only if the price pulls back to our entry point. If the setup triggers and you do not get filled, please enter “at the market” as soon as possible.
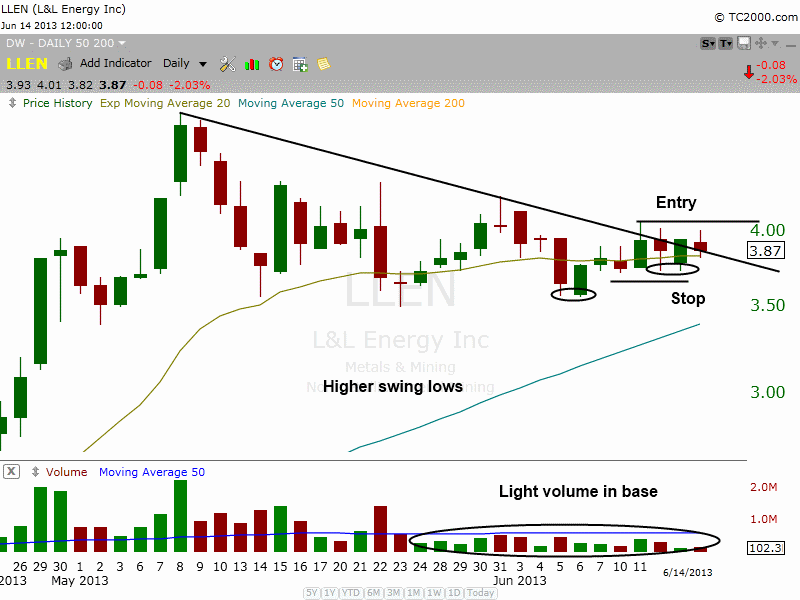
L&L Energy – $LLEN is an official buy setup today with an entry on a break of the daily downtrend line:

If you can, visit the weekly chart so you can see the big pick up in volume on the move off the lows. Since stalling at $5, $LLEN has pulled back in orderly fashion and on declining volume. Our buy entry is over the 4-day high, with a stop beneath the 4-day low. Volume has dried up the past five weeks and that is a bullish sign. Look for the volume to pick up on the move out. We are keeping our share size light due to the lower trading volume and $4 price.