market timing model:
Buy – Signal generated on the close of November 23 (click here for more details)
today’s watchlist (potential trade entries):

Having trouble seeing the open positions graphic above? Click here to view it directly on your web browser instead.
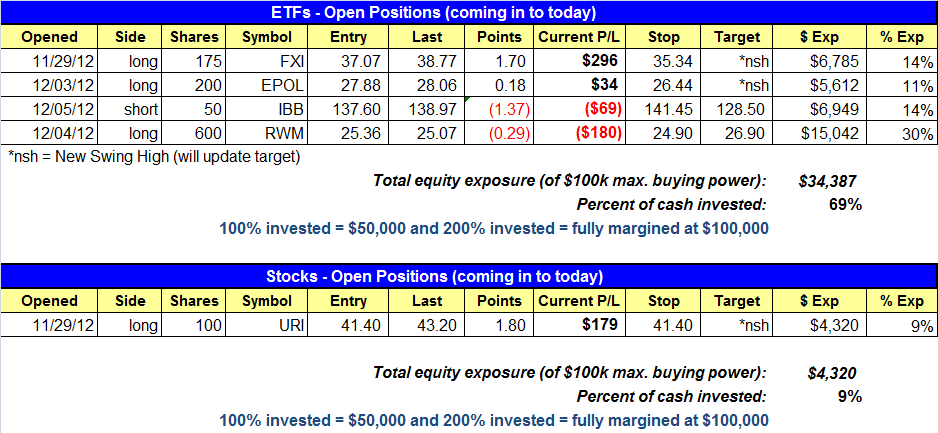
open positions:
Below is an overview of all open positions, as well as a report on all positions that were closed only since the previous day’s newsletter. Net P/L figures are based on two separate $50,000 model portfolios (one for ETFs and one for stocks). Changes to open positions since the previous report are listed in pink shaded cells below. Be sure to read the Wagner Daily subscriber guide for important, automatic rules on trade entries and exits.
Having trouble seeing the open positions graphic above? Click here to view it directly on your web browser instead.
closed positions:

Having trouble seeing the closed positions graphic above?Click here to view it directly on your web browser instead.
ETF position notes:
- No trades were made.
stock position notes:
- No trades were made. Added $PRXL to watchlist.
ETF and broad market commentary:
After edging into positive territory in the first 90 minutes of trading, stocks traded in a tight, sideways range throughout the rest of the session, leaving the major indices flat to modestly higher. Playing catch-up after last week’s relative weakness, the Nasdaq Composite ($COMPQ) ticked 0.3% higher. The S&P 500 ($SPX) was unchanged and the Dow Jones Industrial Average eked out a gain of 0.1%. For the third day in a row, total volume declined in both exchanges. Turnover is likely to remain light as the holiday season approaches.
One industry sector ETF that has shown relative strength since the broad market began its decline off the September highs is S&P Homebuilders SPDR ($XHB). Trading near its five-year high, $XHB only briefly “undercut” horizontal price support in mid-November, right before the major indices formed a near to intermediate-term bottom. Since then, price action has been choppy and seemingly noncommittal. However, $XHB is starting to form a “pennant” formation that could soon lead to a breakout to another new five-year high:

As you can see on the daily chart above, $XHB recently formed a lower high, followed by a higher low, which forms the anchor points of the trend channel of the pennant. Now, we are looking for the price action in $XHB to tighten up, while remaining within the confines of the “pennant.” If price action tightens up, combined with declining volume, the first substantial breakout to the upside would present a potential buy entry.
Although recent price action on the daily chart may look unimpressive, zooming out to the longer-term weekly time interval often gives a better perspective on the “big picture” of the overall trend of an ETF. When looking at the weekly chart below, notice how the choppiness of the past several months appears more as a consolidation near multi-year highs:

Obviously, it’s too soon to buy $XHB right now, but this is one ETF to keep on your radar screen. Additionally, don’t forget the numerous international ETFs we’ve been pointing out over the past week (several Asian and European ETFs), each of which we continue monitoring for a substantial pullback that would present a more positive reward to risk ratio for buy entry.
As mentioned in yesterday’s newsletter, we are presently in “SOH mode” (sitting on hands). While yesterday’s slight relative strength in the Nasdaq was an improvement, the day’s price action was not solid enough to change anything on a technical level. As such, we continue monitoring for new potential trade entries behind the scenes, but are not yet listing any fresh “official” setups on today’s watchlist.
stock commentary:
For those who are new to our service, the timing model is part mechanical and part discretionary. It is very important to understand that just because there is a buy signal in place doesn’t mean that we have to buy anything (if the patterns are not there). Although our timing model generated a buy signal on November 23, the lack of buying interest in top candidates (and our open positions) since then suggests that the market may need more time to consolidate. A market bottom is not a one day event for us, as it normally takes a few weeks for the evidence to build. During this time it is crucial that we take it slow and trade with reduced share to minimize risk. If/when conditions improve we can ramp up our exposure and potentially go on margin.
There is one new official setup on today’s watchlist in PRXL. Will this setup work any better than the unofficial setups ($CRM or $RMD) we listed the past few days we do not know. If market conditions were improving, then we could have been long $CRM, $RMD, $QIHU, $VMC, $VAC, and $PRXL all at once with 12-15% position size per position. However, conditions have not improved since the buy signal, so we are forced to play it very light with maybe 1-2 positions at 7% to 8%.
After a false breakout to new highs in late November, $PRXL has pulled back to and undercut the 20-day EMA. Monday’s bullish reversal candle presents us with a legit entry and a very tight stop at 3.0.% The tight stop allows us to keep our risk low, which is very important when conditions are less than ideal under a buy signal.

If you are a new subscriber, please e-mail [email protected] with any questions regarding our trading strategy, money management, or how to make the most out of this report.
relative strength combo watchlist:
Our Relative Strength Combo Watchlist makes it easy for subscribers to import data into their own scanning software, such as Tradestation, Interactive Brokers, and TC2000. This list is comprised of the strongest stocks (technically and fundamentally) in the market over the past six to 12 months. The scan is updated every Sunday, and this week’s RS Combo Watchlist can be downloaded by logging in to the Members Area of our web site.