market timing model: BUY
Current signal generated on close of November 13.
Portfolio exposure can be anywhere from 50 to 100% long. If positions are holding up well, then one can add exposure beyond 100%.
Past signals:
- Neutral signal generated on close of November 6.
- Buy signal generated on close of September 9
- Neutral signal generated on close of August 15
- Buy signal generated on close of July 11
- Neutral signal generated on close of July 5
- Sell signal generated on close of June 24
today’s watchlist (potential trade entries):

Having trouble seeing the open positions graphic above? Click here to view it directly on your web browser instead.
open positions:
Below is an overview of all open positions, as well as a report on all positions that were closed only since the previous day’s newsletter. Changes to open positions since the previous report are listed in pink shaded cells below. Be sure to read the Wagner Daily subscriber guide for important, automatic rules on trade entries and exits.

Having trouble seeing the open positions graphic above? Click here to view it directly on your web browser instead.
closed positions:

Having trouble seeing the closed positions graphic above? Click here to view it directly on your web browser instead.
ETF position notes:
- No trades were made.
stock position notes:
- $MDCO buy limit order triggered.
ETF, stock, and broad market commentary:
Stocks were hit hard yesterday, with most major averages dropping 1.0% or more on higher volume. In hindsight, Wednesday’s distribution confirms that there was churning (bearish stalling action at the highs) earlier in the week in the S&P 500 and NASDAQ Composite.
Wednesday’s selling does put quite a bit of pressure on the current rally, but the uptrend remains intact in the S&P 500 and NASDAQ Composite. The small and mid-cap averages are relatively weak and in danger of losing the 50-day moving average, which is our line in the sand during a bull market.
What would it take for our timing model to produce a sell signal? A clear sell signal would be generated if most major averages and leading stocks were both under heavy distribution, and major averages were below the 50-day moving average.
We have one new setup on today’s watchlist, and it is a potential short setup in silver. Rather than shorting iShares Silver Trust ($SLV), we are looking to buy ProShares UltraShort Silver ($ZSL) on a pullback.
The weekly chart below details the sharp rally off the lows at the beginning of 2013. $ZSL ran out of gas around $110 and pulled back into the 40-week MA. After two months of chopping around, $ZSL finally broke the downtrend line of the consolidation and rallied, stopping just shy of $100.
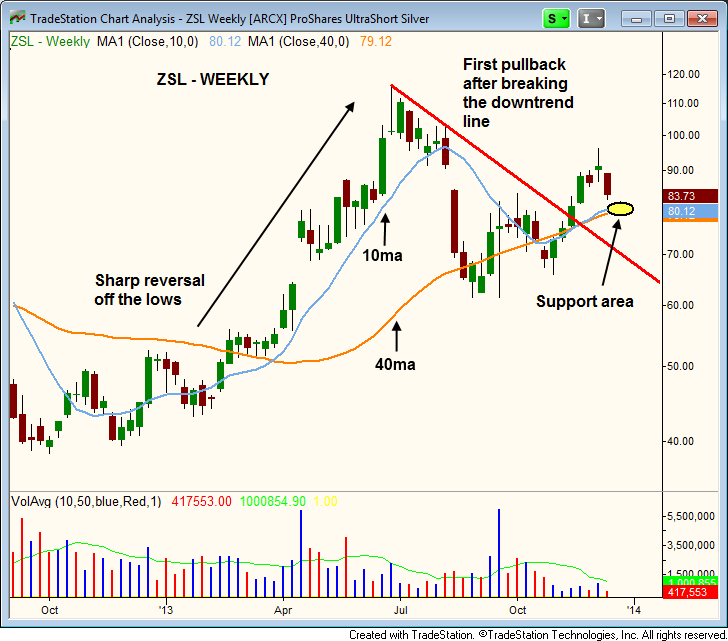
Currently $ZSL is in pullback mode, and we are looking for a potential long entry on weakness at or near support of the 10 and 40-week moving averages.
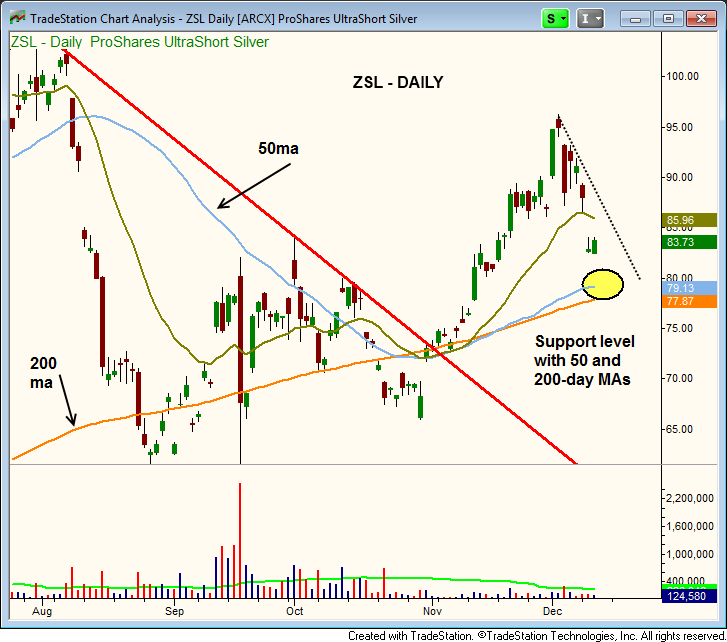
The daily chart shows the gap down below support at $86 this week. Notice how all three major averages (20, 50, 200) are now trending higher and in proper order. The 50-day MA has crossed back above the 200-day MA as well.
As mentioned above, we are looking for an entry on weakness. Trade details can be found in the watchlist section above.
Here are a few more ETFs we are monitoring on the short side should market conditions continue to deteriorate: Emerging markets ETF ($EEM), Brazil ETF ($EWZ), and real estate ($SRS).
We canceled buy setups in $SKYY, $QCLN, $PGJ, and $AAXJ. We will continue to monitor these stocks for bullish reversal candles.
On the stock side, we added one new position in $MDCO, which triggered on weakness.
$MDCO has formed a bullish base near all-time highs and is attempting to breakout from the base. We are looking for the action to test the 10-week MA either this week or next before moving higher.
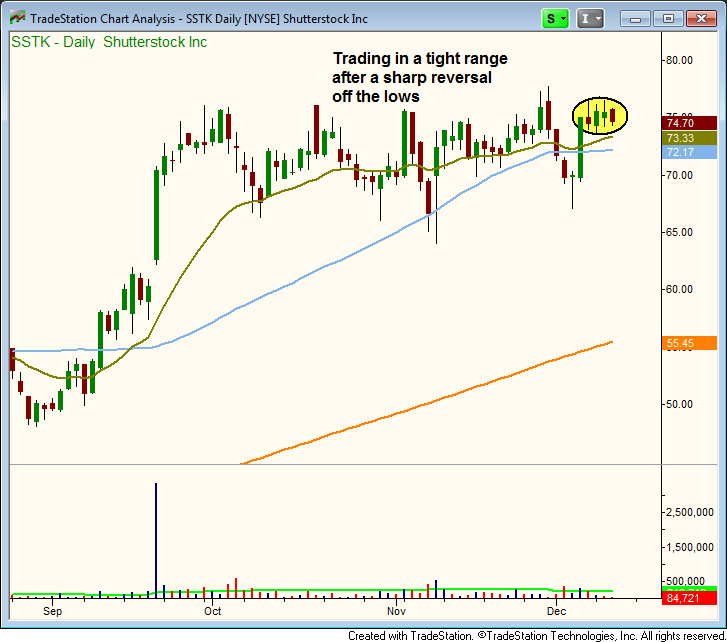
The buy entry is on a slight undercut of last week’s low, with a stop below the 50-day MA. $FB, $SSTK, $HOLI, $KNDI, and $EVR remain in good shape.
$SSTK’s chart is still very tight.
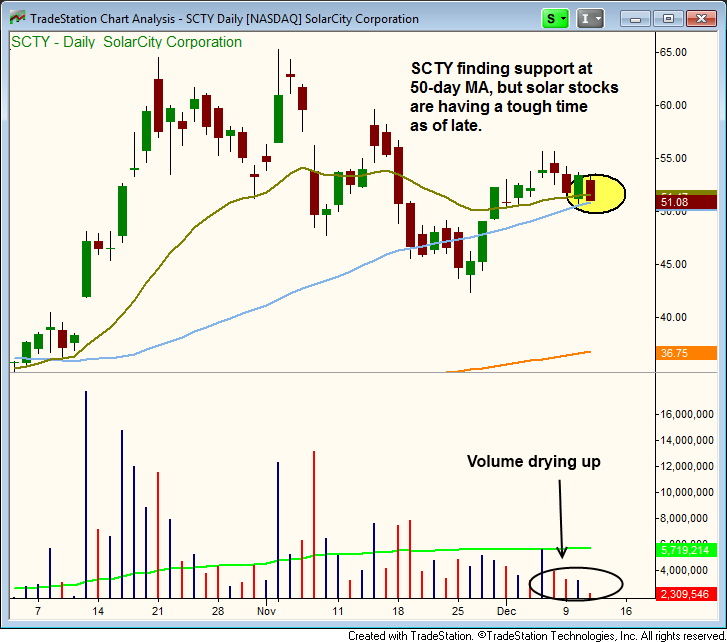
$SCTY is holding up at the 50-day MA so far. The stock has great potential, but the solar group is under heavy selling pressure the past few weeks.