ETFs and market commentary:
Equities closed higher for a third consecutive day but on light trade. The small-cap Russell 2000 matched Thursday’s performance, as it once again tacked on 1.3%. The S&P MidCap 400 posted a solid 0.9% gain, while the Nasdaq added 0.6%. Big cap stocks lagged on the day, as the S&P 500 and Dow Jones Industrial Average could only muster small 0.4% and 0.1% advances, respectively. Only a few sectors finished in the red on the day including, non-ferrous metals, railroads and internet services. Winners included the homebuilder, communications and transportation sectors.
Internals ended mixed for a second consecutive day. Turnover ended fractionally lower on the Nasdaq but 1.5% lower on the Big Board. However, advancing volume outperformed declining volume by a ratio of 2.5 to 1 on the NYSE and 2.1 to 1 on the Nasdaq. Friday’s light volume points to a lack of institutional participation on the day.
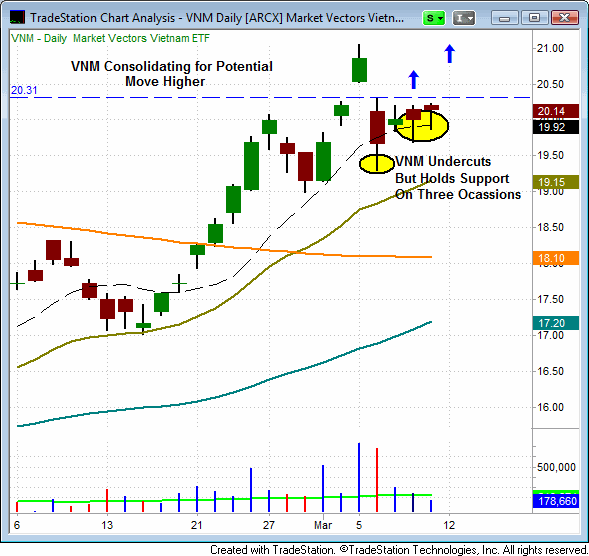
Since setting a new swing high on March 5th, the Market Vectors Vietnam ETF (VNM) has pulled back and been consolidating at its 10-day EMA. We often look to the 10-day MA as a key support level when an ETF is in a strong uptrend. A volume assisted move back above the four day high of $20.21 could present a buying opportunity in this ETF.
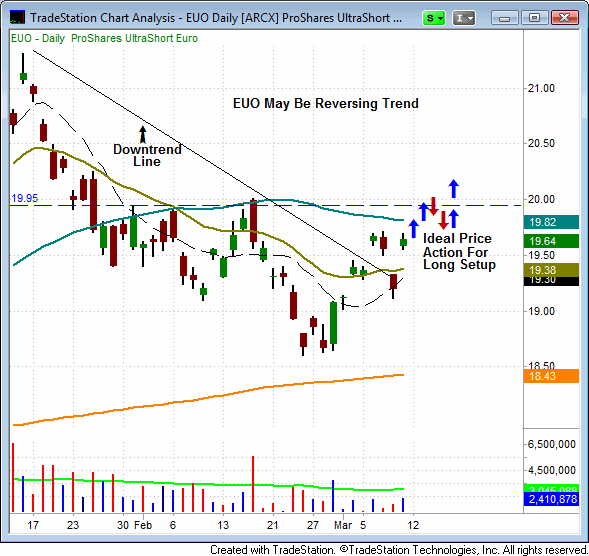
Since January 13th of this year, the ProShares UltraShort Eruo (EUO) has been in a distinct downtrend. However, over the past four sessions, EUO has Rallied and closed above the downtrend line on two separate occasions. The next resistance level for EUO is near $20.00. If EUO can rally back up to and consolidate near this key mark, it could become a long candidate. We are monitoring EUO carefully for a possible entry.
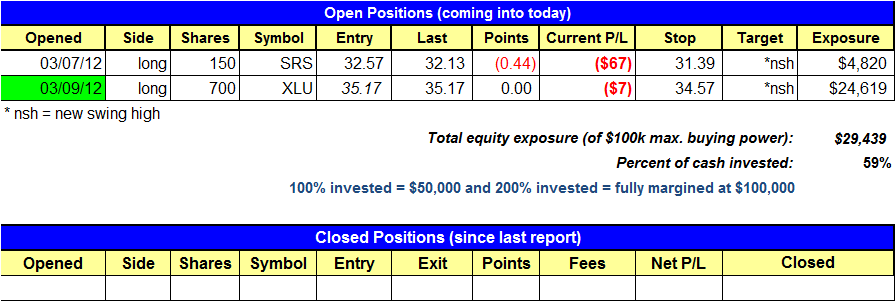
We remain in 150 shares of SRS but if it loses support at Friday’s low of $31.74 we will consider exiting the position. We entered XLU on Friday but half of the trade was entered ahead of the trigger from the watchlist. The other half was entered at the trigger price stated in the watchlist. Total market volume over the past three sessions has been relatively light, as it has come in under the 50-day volume moving average each day. The Nasdaq has seen better volume than the NYSE. We would like to see both indices put in an accumulation day early this week. The Nasdaq has posted three distribution days in the past fifteen and three of the four highest volume days during the same timeframe. Despite the increase in distribution days recently, our market timing model is still presenting a bullish signal. Market sentiment can change quickly but for the moment, there’s still no reason to take a bearish stance.
Today’s ETF Watchlist:
Daily Performance Report:
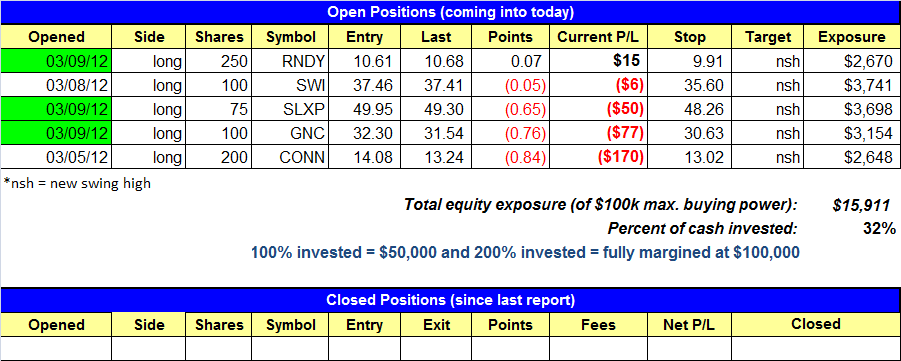
Below is an overview of all open positions, as well as a performance report on all positions that were closed only since the previous day’s newsletter. Net P/L figures are based on the $50,000 Wagner Daily model account size. Changes to open positions since the previous report are listed in red text below. Please review the Wagner DailySubscriber Guide for important, automatic rules on trigger and stop prices
Having trouble seeing the position summary graphic above? Click here to view it directly on your Internet browser instead.
Notes:
- Per intraday alert, XLU buy setup triggered with an average entry rice of 35.17.
- Reminder to subscribers – Intraday Trade Alerts to your e-mail and/or mobile phone are normally only sent to indicate a CHANGE to the pre-market plan that is detailed in each morning’s Wagner Daily. We sometimes send a courtesy alert just to confirm action that was already detailed in the pre-market newsletter, but this is not always the case. If no alert is received to the contrary, one should always assume we’re honoring all stops and trigger prices listed in each morning’s Wagner Daily. But whenever CHANGES to the pre-market stops or trigger prices are necessary, alerts are sent on an AS-NEEDED basis. Just a reminder of the purpose of Intraday Trade Alerts.
- For those of you whose ISPs occasionally deliver your e-mail with a delay, make sure you’re signed up to receive our free text message alerts sent to your mobile phone. This provides a great way to have redundancy on all Intraday Trade Alerts. Send your request to [email protected] if not already set up for this value-added feature we provide to subscribers.
We added three new positions to the portfolio yesterday via intraday alert. For those who were unable to react to Friday’s alert, try to get as close to our entry point as possible today.
Our scans continue to produce solid setups, and we have two new buy setups on today’s watchlist. We are looking to increase our exposure this week, just how much will depend on setups and market conditions.
Today’s Stock Watchlist:
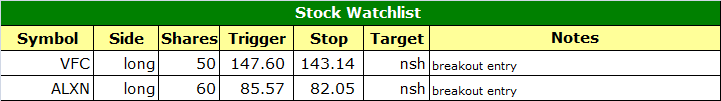
Daily Performance Report:
Below is an overview of all open positions, as well as a performance report on all positions that were closed only since the previous day’s newsletter. Net P/L figures are based on the $50,000 model account size. Changes to open positions since the previous report are listed in red text below.
Having trouble seeing the position summary graphic above? Click here to view it directly on your Internet browser instead.
Notes:
- Per intraday alert, bought RNDY, SLXP, and GNC.
Relative Strength Watchlist:
The Relative Strength (or RS) Watchlist makes it easy for subscribers to import data into their own scanning software, such as Tradestation, Interactive Brokers, and TC2000. The list is comprised of the strongest 100 (or so) stocks in the market over the past six to 12 months. The scan is based on the following criteria and is updated every Monday:
- Stock is in a well defined uptrend, trading above both the 50-day and 200-day moving averages, with the 50-day moving average above the 200-day moving average (both moving averages should be in an uptrend as well).
- Today’s close is less than 20% off the 52-week high
- Close is greater than $5.
- Volume is greater than 200,000 shares per day (using a 50-day volume moving average).
Click here to view this week’s Relative Strength Watchlist in excel
Click here to view this week’s Relative Strength Watchlist as a text file