market timing model: BUY
Current signal generated on close of November 13.
Portfolio exposure can be anywhere from 50 to 100% long. If positions are holding up well, then one can add exposure beyond 100%.
Past signals:
- Neutral signal generated on close of November 6.
- Buy signal generated on close of September 9
- Neutral signal generated on close of August 15
- Buy signal generated on close of July 11
- Neutral signal generated on close of July 5
- Sell signal generated on close of June 24
today’s watchlist (potential trade entries):

Having trouble seeing the open positions graphic above? Click here to view it directly on your web browser instead.
open positions:
Below is an overview of all open positions, as well as a report on all positions that were closed only since the previous day’s newsletter. Changes to open positions since the previous report are listed in pink shaded cells below. Be sure to read the Wagner Daily subscriber guide for important, automatic rules on trade entries and exits.

Having trouble seeing the open positions graphic above? Click here to view it directly on your web browser instead.
closed positions:

Having trouble seeing the closed positions graphic above? Click here to view it directly on your web browser instead.
ETF position notes:
- No trades were made.
stock position notes:
- $BLMN entry did not officially trigger due to 5-minute rule. We are waiving the 5-minute rule for tomorrow’s entry as the price could potentially rip through that level pretty quickly after two days of stalling there.
ETF, stock, and broad market commentary:
Stocks chopped around in a narrow range all day long, leading to minimal gains in most broad market averages. Turnover was lighter on both exchanges, which is to be expected when volatility contracts.
We are already in the second week of December, so after this Friday’s session the market will for the most part be done for the year, as liquidity tends to drop off in mid-December.
In yesterday’s report we discussed the bullish price action in iShares MSCI South Korea ($EWY). In sticking with the Asian theme, tonight’s report will focus on iShares MSCI Hong Kong Index Fund ($EWH) and PowerShares Golden Dragon China ($PGJ)
After breaking down below the 40-week MA (orange line) during the summer, $EWH popped back above the 40-week MA in September, with the 10-week MA (teal line) crossing above the 40-week MA a few weeks later. This is a known a bullish moving average crossover, which by itself is not much of a buy entry, but it does show that momentum is building in the right direction.
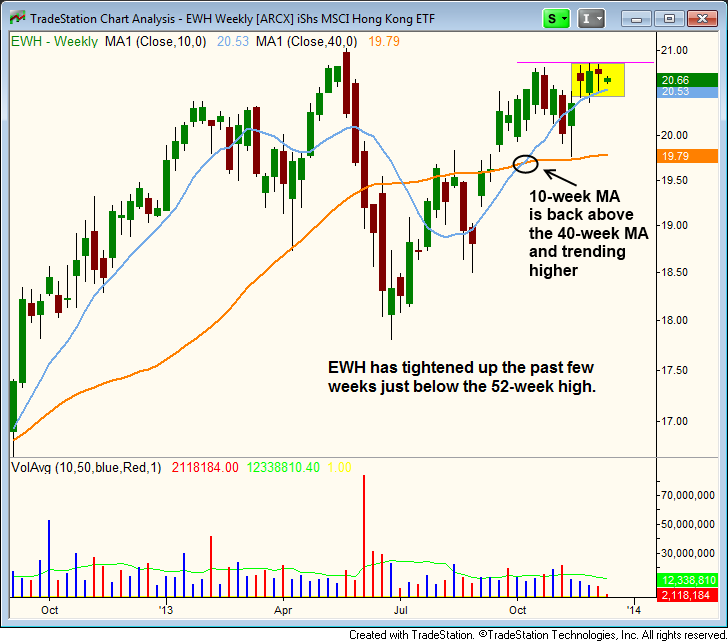
Over the past few weeks, $EWH has formed a very tight range above the rising 10-week MA. If it can continue to trade in a tight range, then we should eventually see a breakout to new 52-week highs.
The action has to stay pretty tight though, as we do not want to see another test of the 40-week MA just below $20.
After an explosive run during the summer, $PGJ stalled out just above $30 and has since formed a bullish base. The price action has held the 50-day MA for the most part, with just a few minor dips below, which is to be expected when a stock/ETF is basing out.
$PGJ has already established a higher low within the base. A second higher low could be in by the end of the week. These higher lows and lower highs lead to a tightening of the price action (from the left side of base to the right), which is exactly what we want to see.
Basing action for the most part is a pretty simple concept. Volatility expands when the price begins to decline and eventually contracts when a bottom starts to form (higher lows within the base). After a few weeks of quiet action, the volatility will pick up once again on the breakout.

$KNDI put in a solid advance yesterday on big volume, breaking above the highs of November. $SSNI also had a respectable day, closing up over 3% on higher volume.
There are no new setups for today, but we are monitoring the action in $TOWR for a potential buy entry within the next few days.
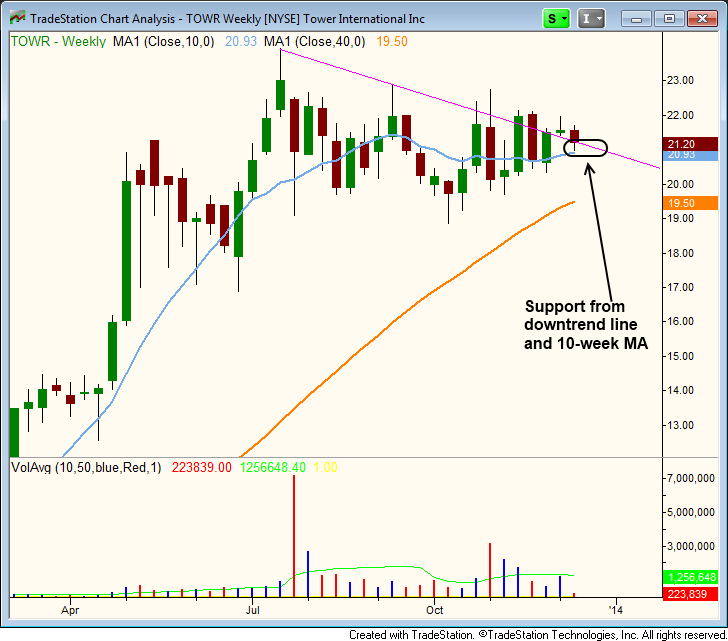
$TOWR has support from the backside of the downtrend line and the 10-week MA (teal line) around $21. The action should hold above $20 at the very least.
$TOWR advanced to new-all time highs earlier this year, so a breakout above the current base high would lead to blue skies (no resistance above).