market timing model:
Sell – Signal generated on the close of October 12 (click here for more details)
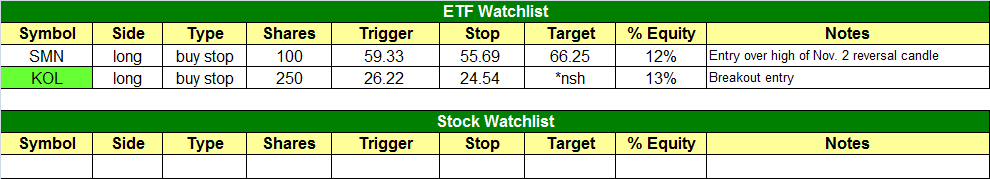
today’s watchlist (potential trade entries):
Having trouble seeing the open positions graphic above? Click here to view it directly on your web browser instead.
open positions:
Below is an overview of all open positions, as well as a report on all positions that were closed only since the previous day’s newsletter. Net P/L figures are based on two separate $50,000 model portfolios (one for ETFs and one for stocks). Changes to open positions since the previous report are listed in pink shaded cells below. Be sure to read the Wagner Daily subscriber guide for important, automatic rules on trade entries and exits.
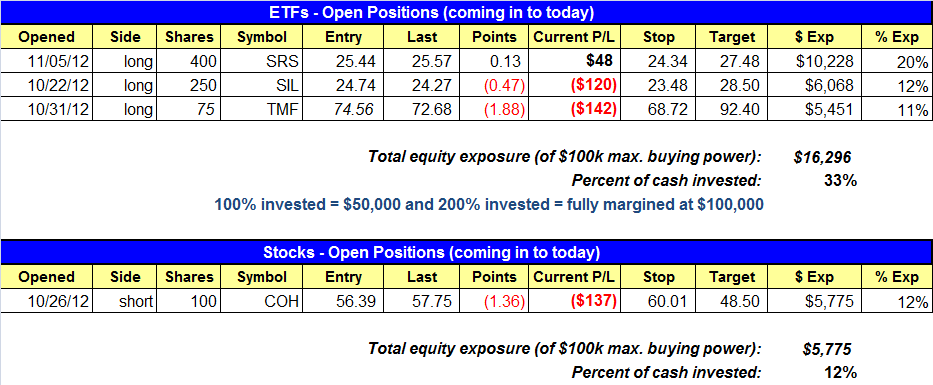
Having trouble seeing the open positions graphic above? Click here to view it directly on your web browser instead.
closed positions:

Having trouble seeing the closed positions graphic above? Click here to view it directly on your web browser instead.
ETF position notes:
- Note the new setup in KOL.
stock position notes:
- No trades were made.
ETF and broad market commentary:
After getting off to a slightly higher start, stocks drifted sideways throughout the morning, jumped higher at midday, then drifted back down to surrender a bit of their intraday gains in the afternoon. The major indices all closed higher, but below their intraday lows of November 2 (the big bearish reversal day). The Dow Jones Industrial Average ($DJIA) led the day with a 1.0% gain, the S&P 500 Index ($SPX) rallied 0.8%, and the Nasdaq Composite ($COMPX) rose 0.4%. The S&P Midcap 400 Index ($MID) also turned in a solid performance by climbing 1.0%, as the small-cap Russell 2000 Index ($RUT) increased 0.7%. Once again it is by the relative weakness in Apple ($AAPL) and other large-cap tech stocks, the Nasdaq 100 Index ($NDX) ticked just 0.3% higher. Showing a lack of direction into the close, the main stock market indexes closed near the middle of their intraday trading ranges.
Total volume in the NYSE increased 12% above the previous day’s level, while turnover in the Nasdaq swelled 19%. The higher volume technically caused both the S&P 500 and Nasdaq to register a bullish “accumulation day,” indicative of buying amongst banks, mutual funds, and hedge funds. Nevertheless, the fact that the major indices showed indecision into the close demonstrated a lack of conviction among the bulls. Advancing volume in the Nasdaq exceeded declining volume by a ratio of just over 3 to 2. At more than 3 to 1, the NYSE ADV/DEC volume ratio suggested better market breadth. Given that it was election day, the substantially higher volume across the board was actually a bit surprising. However, turnover in both exchanges was only slightly above 50-day average levels.
Going into today, we’re stalking a new potential ETF buy entry in Market Vectors Coal ETF ($KOL). After being in downtrend from April 2011 until September 2012, KOL is now setting up as a short-term, momentum-based bullish trend reversal play. On the daily chart below, notice that the 20 day moving averages recently crossed above the 50 day moving average, which is a bullish signal, although the 200-day moving average (orange line above the current price) has not yet started sloping higher. Nevertheless, there is a clearly defined area of horizontal price support and daily chart, and the ETF is also formed a pattern that is similar to an inverse head and shoulders. The head and shoulders chart pattern is bearish when it forms near the highs after an extended rally, and usually leads to new near-term lows. Conversely, an inverse head and shoulders is bullish when it forms around the near-term lows of a protracted downtrend, and will frequently lead to new “swing highs.” On the chart below, we have annotated the components of the inverse head and shoulders pattern. Finally, notice that a breakout above the three-day high in KOL will also correspond to a breakout above a substantial area of horizontal price resistance, as well as the neckline of the inverse head and shoulders pattern. As such, we are adding KOL to our ETF watchlist as an “official” trade setup today

In addition to being an inverse head and shoulders pattern, notice that the right shoulder is higher than the left shoulder. This tells us there were less sellers on the pullback after the formation of the head. A higher right shoulder than the left shoulder with this type of pattern is a bullish indicator. Although this is a trade setup for a long position, the fact it is a commodity ETF means the play has relatively low correlation to the direction of the broad market. Otherwise, we would not be looking at bullish trade setups because our market timing model remains in “sell” mode at the present moment.
Yesterday, our existing long position in Global X Silver Miners ETF ($SIL) got off to a rough start in the morning, but reversed to close near its intraday high, this resulted in the formation of a bullish hammer candlestick pattern that also “undercut” key intermediate-term support of its 50-day moving average. This is exactly type of price actually like to see during periods of consolidation, as it serves to shake out the “weak hands” who typically sell when stocks and ETFs break obvious technical levels of price support. If you are a new subscriber or happened to miss our initial buy entry, SIL prevents a low-risk buy entry on a rally above yesterday’s high (around the $24.45 level).
At the time of this writing, all eyes are focused on the results of the US presidential election. However, we encourage you not to get too wrapped up in the results and its perceived impact on the market. Other than perhaps a short-term, knee-jerk reaction, the winner of each presidential election typically has much less to do with the future direction of the stock market than one may wish to believe. Rather, it is technical analysis and time cycles that really determines the direction of the market’s next move.
Some newsletter subscribers do not follow our actual entry and exit points for our stock and ETF swing trade setups, but still subscribe to The Wagner Daily to benefit from our reliable system for market timing. If this is you, be assured it is technically not yet the time to re-enter the market and start buying your favorite stocks and ETFs. As mentioned in yesterday’s stock commentary section of our newsletter, it is simply too easy to dig yourself into a whole when trying to fight the dominant broad market trend. Still, we realize market conditions can change quickly, so we’ll be sure to alert subscribers if/when our market timing signal shifts back into “neutral” or “buy” mode.
stock commentary:
Although the S&P 500 and Nasdaq Composite have held above the most recent swing low the past five sessions, we are still waiting for a strong accumulation day to confirm that a potential intermediate-term bottom is in place. In yesterday’s report we laid out the process we go through each time a market attempts to bottom out. There is no rush to buy stocks as there will be plenty of time to make money IF a new bull market rally is under way. Should the timing model shift to a buy signal this week we plan to start off with a few light positions to test the water. If these positions work, then we will add more positions and step up our share size.
With the market attempting to rally off the lows there isn’t much that is actionable on the short side. Maybe we’ll see some short setups develop later this week or early next week, provided that the timing model does not go in to buy mode.
If you are a new subscriber, please e-mail [email protected] with any questions regarding our trading strategy, money management, or how to make the most out of this report.
relative strength combo watchlist:
Our Relative Strength Combo Watchlist makes it easy for subscribers to import data into their own scanning software, such as Tradestation, Interactive Brokers, and TC2000. This list is comprised of the strongest stocks (technically and fundamentally) in the market over the past six to 12 months. The scan is updated every Sunday, and this week’s RS Combo Watchlist can be downloaded by logging in to the Members Area of our web site.