Buy– Signal generated on the close of December 31 (click here for more details)
today’s watchlist (potential trade entries):

Having trouble seeing the open positions graphic above? Click here to view it directly on your web browser instead.
open positions:
Below is an overview of all open positions, as well as a report on all positions that were closed only since the previous day’s newsletter. Net P/L figures are based on two separate $50,000 model portfolios (one for ETFs and one for stocks). Changes to open positions since the previous report are listed in pink shaded cells below. Be sure to read the Wagner Daily subscriber guide for important, automatic rules on trade entries and exits.
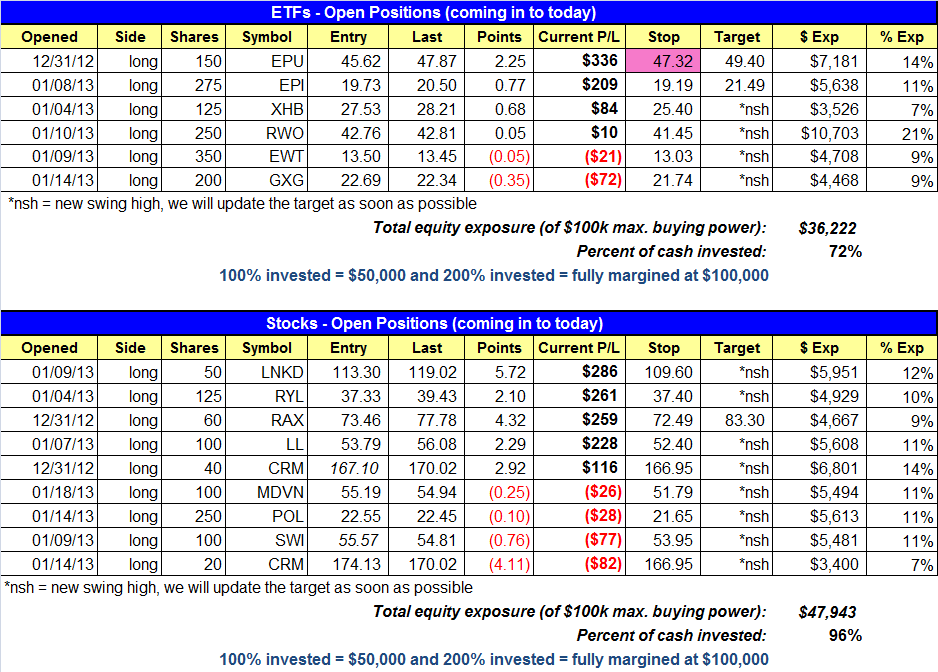
Having trouble seeing the open positions graphic above? Click here to view it directly on your web browser instead.
closed positions:

Having trouble seeing the closed positions graphic above? Click here to view it directly on your web browser instead.
ETF position notes:
- See the open position and watchlist sections above for changes.
stock position notes:
- $MDVN buy stop triggered.
ETF, stock, and broad market commentary:
5-Minute Rule:
How to handle stocks/ETFs that trade through our buy stop within the first 5-minutes of trading
- : No buy stops go live until 5 minutes after the stock market opens. So if the price action trades through our buy stop within the first 5-minutes of trading we do nothing and simply wait for 5-minutes. At 9:35 we mark the 5-minute high and add 10 cents to the 5-minute high as the new official entry point. As long as the 5-minute high is not more than 1.3% above the original trigger point the setup is still valid. If the 5-minute high (not adding the 10 cents) is more than 1.3% above our trigger, the trade is automatically canceled.
How to handle a morning gap up above our trigger: If the morning gap up is more than 1.3% above our entry the trade is automatically canceled. If the gap up is less than or equal to 1.3% we wait for 5-minutes to pass and then set a buy stop 10 cents above the 5-minute high, provided that the 5-minute high is not more than 1.3% above the original trigger.
The 5-minute rule does not apply to buy limit orders, where we are looking to enter on weakness. But as with a buy stop order, if a stock/ETF opens more than 1.3% below our buy limit order the trade is automatically canceled.
In keeping with the theme of the past few weeks, stocks sold off during the morning session but recovered nicely in the afternoon, with all major averages setting new intraday highs in final 30-minutes of trading. While broad market gains were modest (Dow was biggest mover at only +0.4%), the price action continues to impress with buyers always ready to step in on weakness.
Higher volume on the Nasdaq and NYSE led to accumulation days for both the S&P 500 and Nadsaq Composite. It’s always good to see accumulation, but with the market already having enough momentum we are more concerned with the major averages avoiding distribution. Accumulation days are much more valuable when the market is attempting to bottom out after a selloff.
We updated the stop in $EPU to lock in gains in case Friday’s low does not hold. $KBE has yet to officially trigger a buy entry for us, but for those who are already long please continue to hold using the stop listed in the watchlist section above. The same can be said for $RSX, which also did not officially trigger due to an opening gap up. For those who are long $RSX, continue to hold with the stop listed in the watchlist section above. Please note the switch from buy stop order to a buy limit order in $RSX on the watchlist above. Since we are using a buy limit order, the setup can trigger within the first 5-minutes of trading (the 5-minute rule does not apply).
In last week’s commentary we mentioned that the Market Vectors-Coal ($KOL) could potentially find support on a pullback to the rising 20-day EMA and 200-day MA around 25.50. This support level looks like it wants to hold, and if it does, will create another higher swing low on the right side of the base. As we have mentioned in past reports, the price action should make higher swing lows within the base, along with a tightening of the price action. Our buy entry in $KOL is over Friday’s high. We are placing a protective stop beneath the prior swing low from last December.

The daily chart of SPDR Dow Jones Global Real Estate ($RWO) continues to trade in a tight range beneath the highs of the base. Starting from the beginning of the pattern in September, $RWO’s price action is a solid example of what we look for when identifying bullish price action in a base.

When looking at a base we typically see more volatility on the left hand side of the pattern, as the stock/ETF enters distribution mode and sells off for several weeks. At one point during the decline, the price action will either udercut a previous low and reverse higher or simply explode higher and hold. This is usually when the downtrend line of the base is broken and the pattern begins to form the “right side”, establishing higher swing highs and higher swing lows. With $RWO, the price action bottomed out by undercutting a prior swing low and reversing sharply off the 200-day MA. Since then it has formed a series of higher highs and lows, with the price action tightening up below the highs of the base. This tightening of the price action does not always have to form just below the highs of the base, it could form anywhere from 5-10% off the highs.
On the stock side, $MDVN triggered a buy entry on a heavy volume reversal candle. We removed $SODA from the watchlist for now, but we will continue to monitor the action, as we still like the setup.
$POL continues to hang around after a less than impressive start. Note the recent dry up in volume the past few days. A dry up in volume does not guarantee the stock will go higher, but within a bullish pattern it’s usually a good sign.

CRM needs to hold the shakeout bar low of Jan. 16 or we will stop out. We prefer to see recent breakouts hold the 20-day EMA. When they do not holdthe 20-day EMA it suggests further consolidation is needed. We do not mind stopping out of stocks that are moving too slow when the market is acting well, as portfolio rotation is key for us in a bull market. The capital can be use to invest in a stock that is potentially ready to explode higher.

If you are a new subscriber, please e-mail [email protected] with any questions regarding our trading strategy, money management, or how to make the most out of this report.
relative strength combo watchlist:
Our Relative Strength Combo Watchlist makes it easy for subscribers to import data into their own scanning software, such as Tradestation, Interactive Brokers, and TC2000. This list is comprised of the strongest stocks (technically and fundamentally) in the market over the past six to 12 months. The scan is updated every Sunday, and this week’s RS Combo Watchlist can be downloaded by logging in to the Members Area of our web site.