Commentary:
On Friday, the major indices completed an uneventful week with an uneventful day. However, volume spiked sharply. Stocks closed mixed for the day. The higher beta issues posted minor gains, as blue chip stocks were down slightly on the session. The small-cap Russell 2000 found its way to a 0.4% gain, while both the Nasdaq and the S&P MidCap 400 posted minimal 0.2% advances. The S&P 500 eked out .1% gain, but the Dow Jones Industrial Average closed off by 0.1%. There were signs that leadership was returning to the market.
Although somewhat mixed, Friday’s market internals were decidedly more impressive than the price action. Turnover skyrocketed on triple witching, options expiration Friday. The NYSE saw turnover advance by whopping 53%, while volume on the Nasdaq jumped by over 40% yesterday. But, advancing volume only marginally outpaced declining volume on both indices. On the NYSE the ratio ended the day at a positive 1.4 to 1, while the Nasdaq posted a plus 1.3 to 1 margin.
Bond ETFs staged a big rally on Friday. Agricultural and commodity ETFs also performed well yesterday, as International real estate got pounded (See RWX). Emerging market ETFs also exhibited relative weakness (See GMF). It appears as if money may be rotating out of the international, emerging market arena and into commodities, agriculture, oil and oil/related ETFs. We are watching closely for further evidence of this rotation, as it can provide technical clues as to where we should be looking for trade opportunities.
Approximately three months ago (See September 20th newsletter and intraday alert) we entered a position in the iShares Nasdaq Biotechnology ETF (IBB), as it broke above the neckline of an inverse head and shoulders reversal pattern. At that time we stated, “IBB appears to be forming a distinct inverse head and shoulders pattern. The left shoulder low was set on June 8th, the head on July 1st, and the right shoulder on August the 25th. On Friday (September 17th), it broke above the 200-period simple moving average on increasing volume. A volume-fueled move above the neckline high of $84.81 would confirm the pattern. The predicted rally, measured from the bottom of the head to the neckline, would suggest an advance to near the March 24th high of $93.53.”
In November we sent out an alert that we were exiting IBB. At the time we decided to exit before IBB reached our target since it was at a key resistance level (around $90.00), and the market was showing signs of weakness. Since selling the position, this ETF has followed through and reached our original target of $93.53. Notice how the predicted rally from the inverse head and shoulders coincides with the Fibonacci extensions (Fibonacci extensions drawn from the July 1st low of $74.50 to the August 9th high of $84.81).
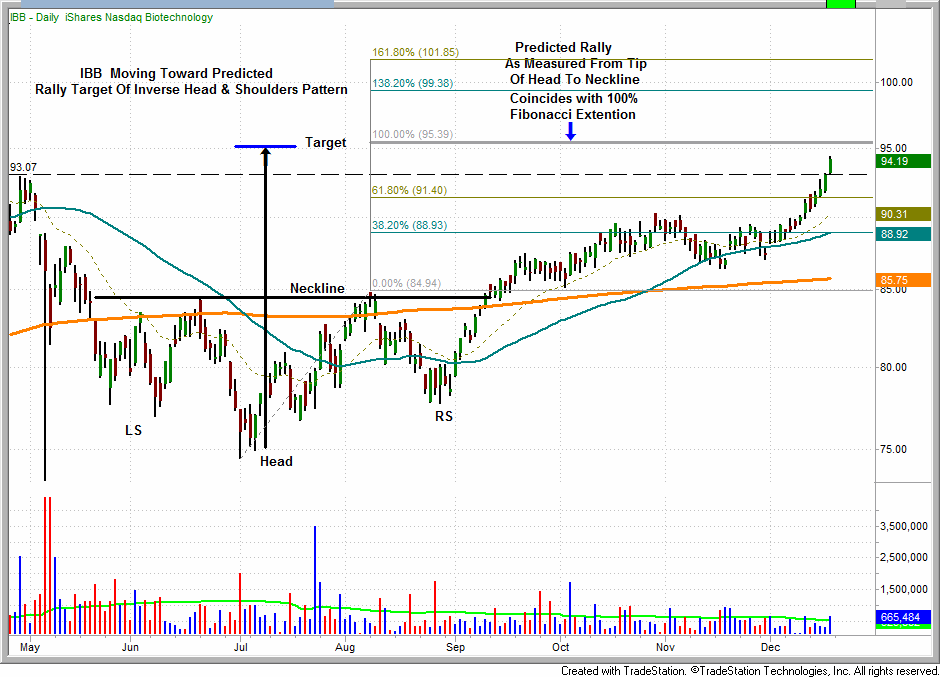
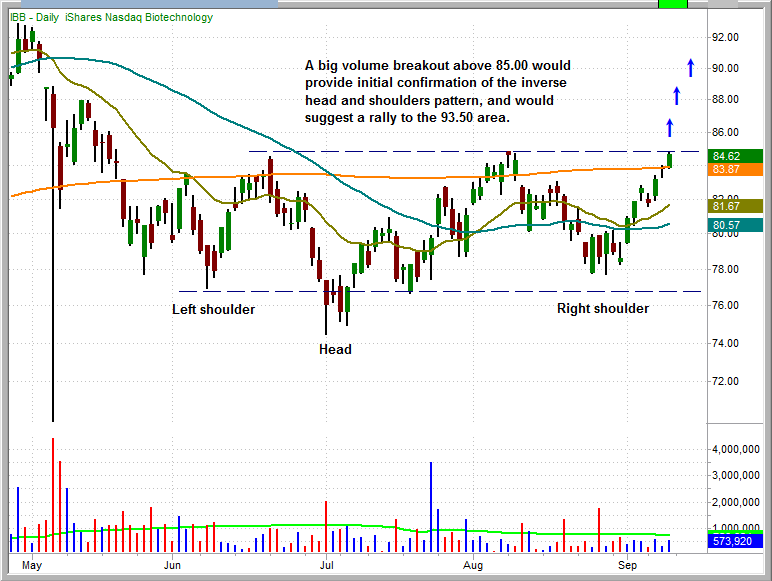
Head and shoulders patterns, when analyzed correctly, are a powerful technical trading pattern, and one of our favorites.
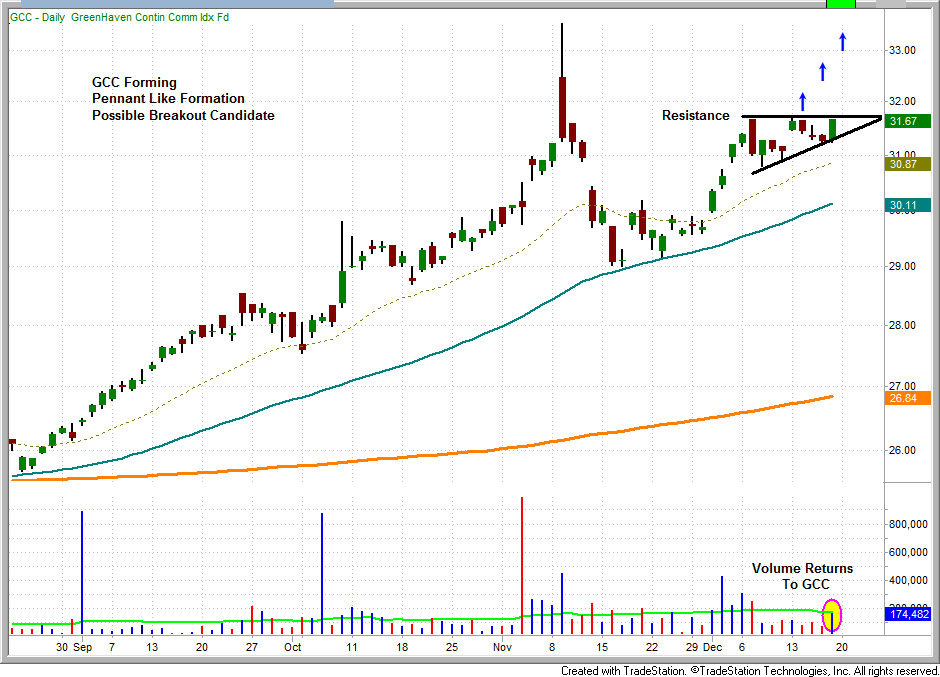
The GreenHaven Continuous Commodity Index ETF (GCC), has been consolidating in a tight trading range since the December 3rd gap up. Further, it has formed an ascending pennant like formation. Volume in this ETF increased significantly on Friday, suggesting institutional interest. A break above the December 13th high of $31.68 could carry GCC to a retest of the November 9th high of $33.53, and potentially to a new 52 week high.
The lack of follow through from large cap stocks, and the muted market internals have likely contributed to the lack of follow through in the overall market. But, volume was impressive on Friday. Should price action follow suit, we could see a strong year-end rally.
Today’s Watchlist:
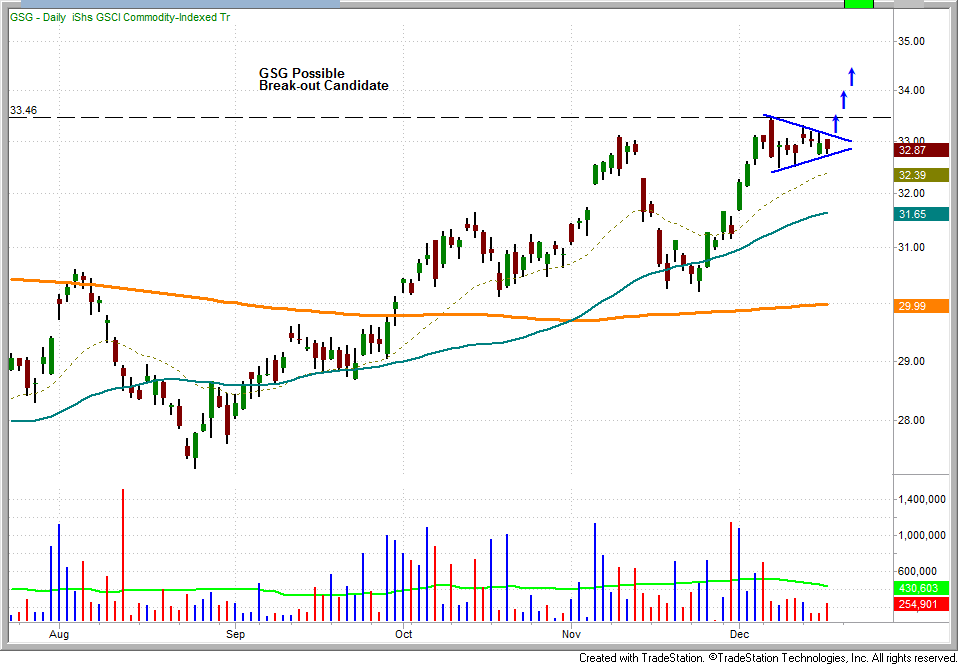
GSG
Long
Shares = 350
Trigger = 33.52
Stop = 31.84
Target = 36.70
Dividend Date = n/a
Notes = see commentary from Dec. 17 issue
Daily Performance Report:
Below is an overview of all open positions, as well as a performance report on all positions that were closed only since the previous day’s newsletter. Net P/L figures are based on the $50,000 Wagner Daily model account size. Changes to open positions since the previous report are listed in red text below. Please review the Wagner Daily Subscriber Guide for important, automatic rules on trigger and stop prices
Since UNG closed near our stop last Friday, we will be using the 20-minute low minus 5 cents or the original stop of 5.47 (whichever is lower) as the official stop price.
- Reminder to subscribers – Intraday Trade Alerts to your e-mail and/or mobile phone are normally only sent to indicate a CHANGE to the pre-market plan that is detailed in each morning’s Wagner Daily. We sometimes send a courtesy alert just to confirm action that was already detailed in the pre-market newsletter, but this is not always the case. If no alert is received to the contrary, one should always assume we’re honoring all stops and trigger prices listed in each morning’s Wagner Daily. But whenever CHANGES to the pre-market stops or trigger prices are necessary, alerts are sent on an AS-NEEDED basis. Just a reminder of the purpose of Intraday Trade Alerts.
- For those of you whose ISPs occasionally deliver your e-mail with a delay, make sure you’re signed up to receive our free text message alerts sent to your mobile phone. This provides a great way to have redundancy on all Intraday Trade Alerts. Send your request to [email protected] if not already set up for this value-added feature we provide to subscribers.
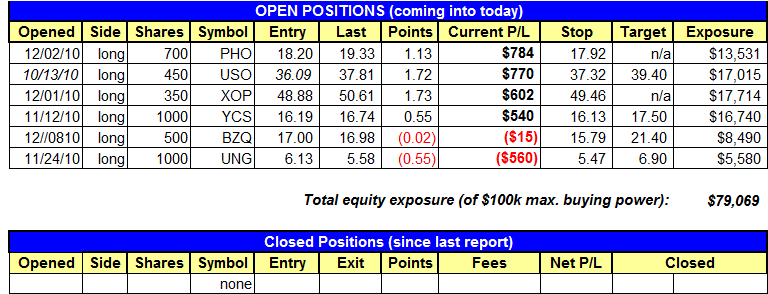
Having trouble seeing the position summary graphic above?
Click here to view it directly on your Internet browser instead.
Notes:
Edited by Deron Wagner,
MTG Founder and
Head Trader