Buy Mode
– Timing model generated buy signal on close of March 5 (click here for more details)
today’s watchlist (potential trade entries):

Having trouble seeing the open positions graphic above? Click here to view it directly on your web browser instead.
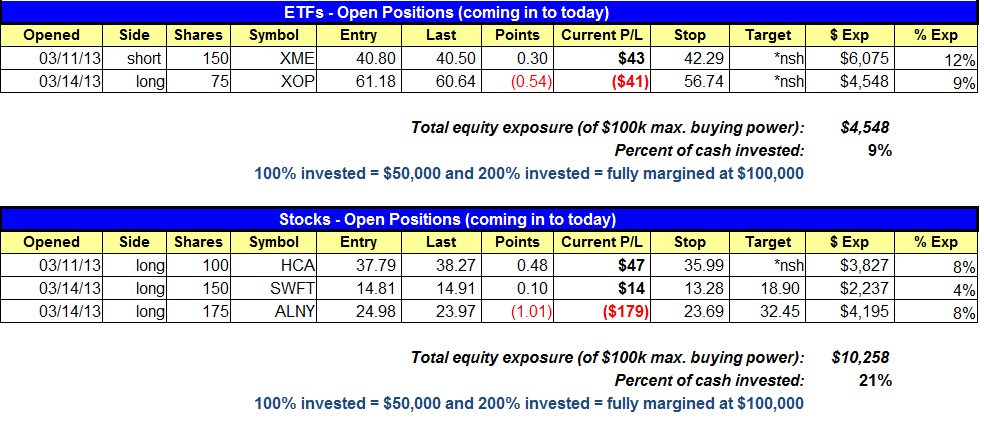
open positions:
Below is an overview of all open positions, as well as a report on all positions that were closed only since the previous day’s newsletter. Net P/L figures are based on two separate $50,000 model portfolios (one for ETFs and one for stocks). Changes to open positions since the previous report are listed in pink shaded cells below. Be sure to read the Wagner Daily subscriber guide for important, automatic rules on trade entries and exits.

Having trouble seeing the open positions graphic above? Click here to view it directly on your web browser instead.
closed positions:

Having trouble seeing the closed positions graphic above? Click here to view it directly on your web browser instead.
ETF position notes:
- $TBF trade is cancelled for now but we will continue to monitor the action.
stock position notes:
- No trades were made.
ETF, stock, and broad market commentary:
Stocks sold off on increased volume producing a bearish distribution day for the Nasdaq and S&P 500. The only positive to come out of yesterday’s selling was that once again buyers stepped in during the last 90 minutes of trading to lift the averages off the lows of the day.
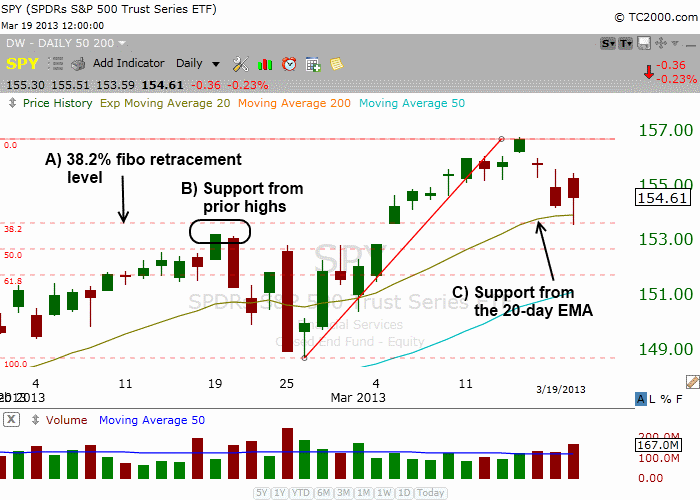
Looking at a daily chart of the S&P 500 ETF ($SPY) below, there is a cluster of support in the 153.00 – 154.00 area:

- Point A – Measuring the last rally off the lows, the 38.2% retracement level is around 153.70.
- Point B – There is support from the breakout pivot area around 153.20. This is the key breakout level that should hold (allowing for 1 or 2 shakeout bars below support).
- Point C – Support from the rising 20-day EMA at 154.00.
After bottoming out last summer, the iShares MSCI Israel Index ($EIS) rallied 20% off the lows before stalling out at prior highs from April 2012. Since mid-Decemebr the price action has tightended up nicely while holding above the rising 10-week MA.

The 10-week MA crossed above the 40-week MA last November, and the strong price action since then has created a wide spread in the moving averages which is typically a bullish sign. We are monitoring the action for a clear breakout above the range highs as a buy signal, especially if the breakout holds up on the weekly chart.
On the stock side, $HCA and $SWFT held up well while $ALNY broke down. $ALNY just missed our stop by a few cents so we remain long.
We are monitoring a few stocks for entry points over the next few days. $OPEN, $WDC, $PHM, $MTH (for a pullback), $TGH, and $FNGN are in good shape.
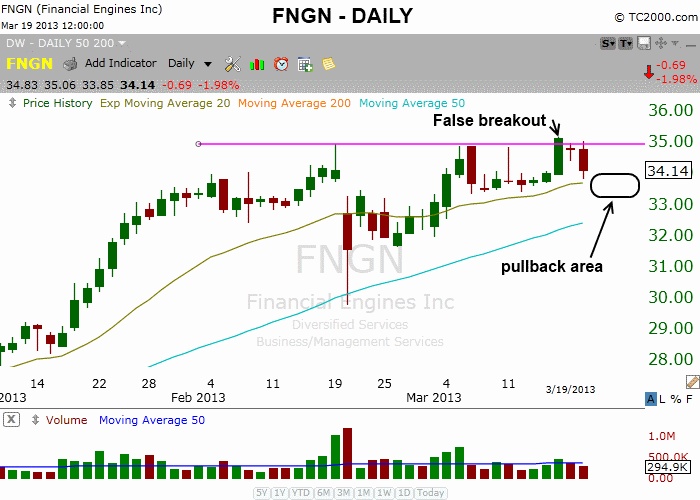
$FNGN is consolidating in a tight range on the daily chart below:

$FNGN has a relative strength ranking of 93 with solid earnings and reventue growth. Along with the strong fundamentals and technicals, its industry group ranking is #18 out of of 197, which is very strong. We’d like to see an undercut of the 20-day EMA within the next few days to provide us with a low risk entry point. This is not an official setup, as we are just monitoring the action for now.
relative strength combo watchlist:
Our Relative Strength Combo Watchlist makes it easy for subscribers to import data into their own scanning software, such as Tradestation, Interactive Brokers, and TC2000. This list is comprised of the strongest stocks (technically and fundamentally) in the market over the past six to 12 months. The scan is updated every Sunday, and this week’s RS Combo Watchlist can be downloaded by logging in to the Members Area of our web site.