Current signal generated on close of August 15.
Portfolio long exposure can be anywhere from 30%-50% if you just joined the letter, or up to 100% (if your stocks are holding up).
Past signals:
- Buy signal generated on close of July 11
- Neutral signal generated on close of July 5
- Sell signal generated on close of June 24
today’s watchlist (potential trade entries):

Having trouble seeing the open positions graphic above? Click here to view it directly on your web browser instead.
open positions:
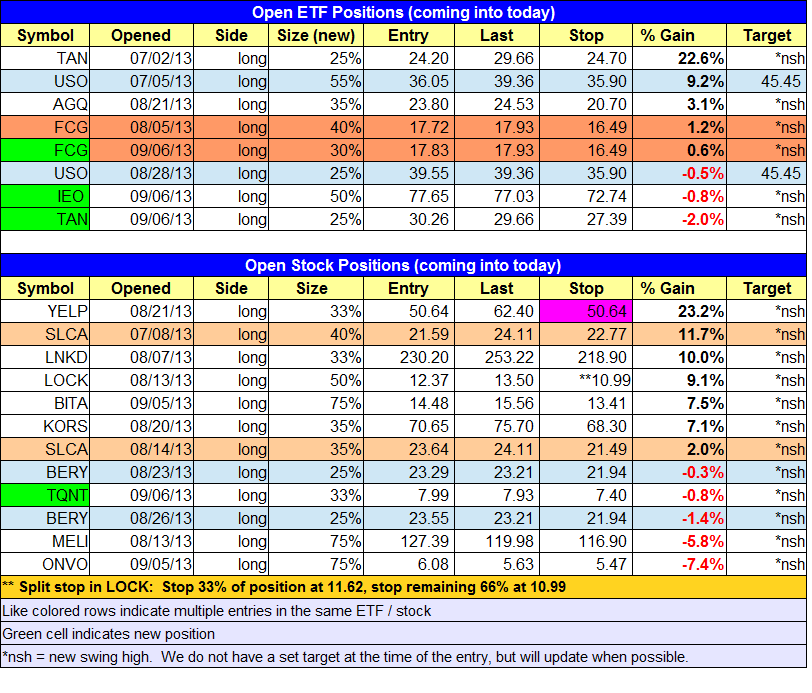
Below is an overview of all open positions, as well as a report on all positions that were closed only since the previous day’s newsletter. Changes to open positions since the previous report are listed in pink shaded cells below. Be sure to read the Wagner Daily subscriber guide for important, automatic rules on trade entries and exits. Click here to learn the best way to calculate your share size.
Having trouble seeing the open positions graphic above? Click here to view it directly on your web browser instead.
closed positions:

Having trouble seeing the closed positions graphic above? Click here to view it directly on your web browser instead.
ETF position notes:
- $IEO, $FCG, and $TAN all triggered.
stock position notes:
- $TQNT triggered. Note that $SGMO is listed twice due to the split stops.
ETF, stock, and broad market commentary:
Stocks recovered nicely from a sharp selloff in the first 30-minutes of trading, with all averages closing in positive territory except for the Dow Jones. The NASDAQ Composite printed a bullish reversal candle after a strong recovery off support from the 20 and 50-day MAs, closing in the top 1/3 of the day’s range.
With the market yet to produce a buy signal, those who lack conviction on the long side may find it difficult to hold on to a long position when there is a short-term shakeout in the market. This is why it is always important to plan the trade and trade the plan. Most of us are guilty of an impulse trade every once in a while, but for short to intermediate-term swing traders, this should not become a habit. Getting in and out of positions quickly, based on short-term intraday moves, is a pretty good sign of over trading. When this happens it is best to take a short break from trading to clear the mind.
We added to our long position in Guggenheim Solar ETF ($TAN) on Friday, after it cleared the highs of a six-week trading range on strong volume earlier in the week.
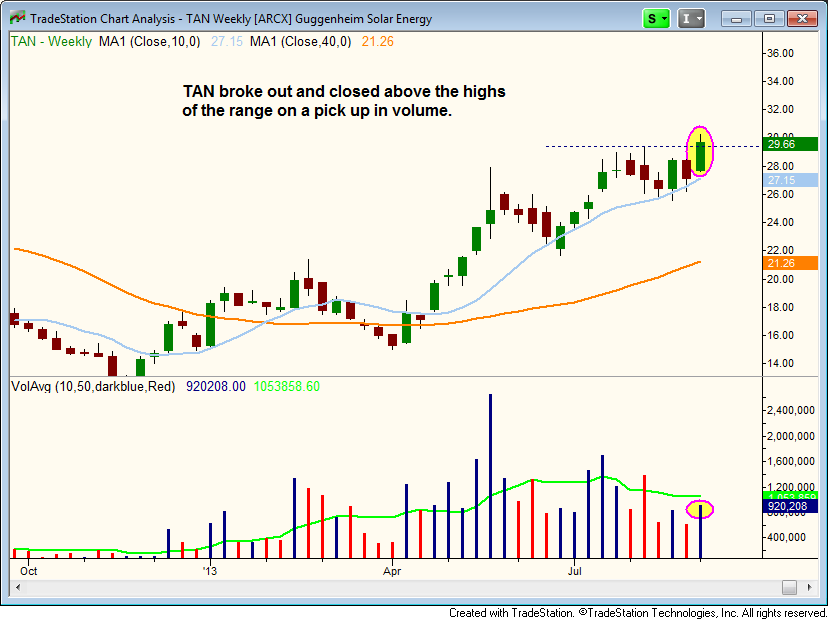
There isn’t much resistance on the weekly chart, so as long as $TAN holds support from the rising 10-week MA and weekly uptrend line it should eventually hit the $36 – $38 area.
We added to an exiting position in $USO two weeks ago, on a continuation breakout above $38.50. However, the breakout failed to stick and pulled back in before finding support at the rising 20-day EMA.
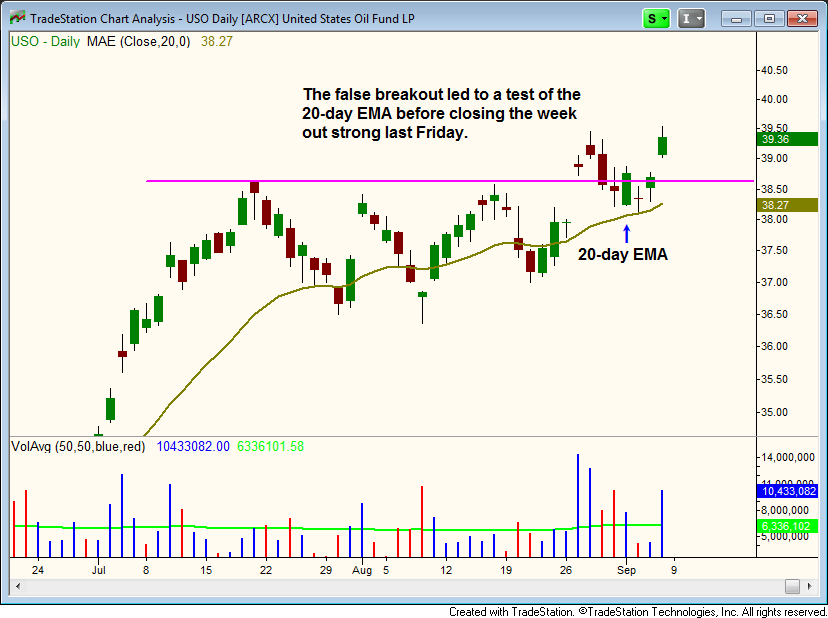
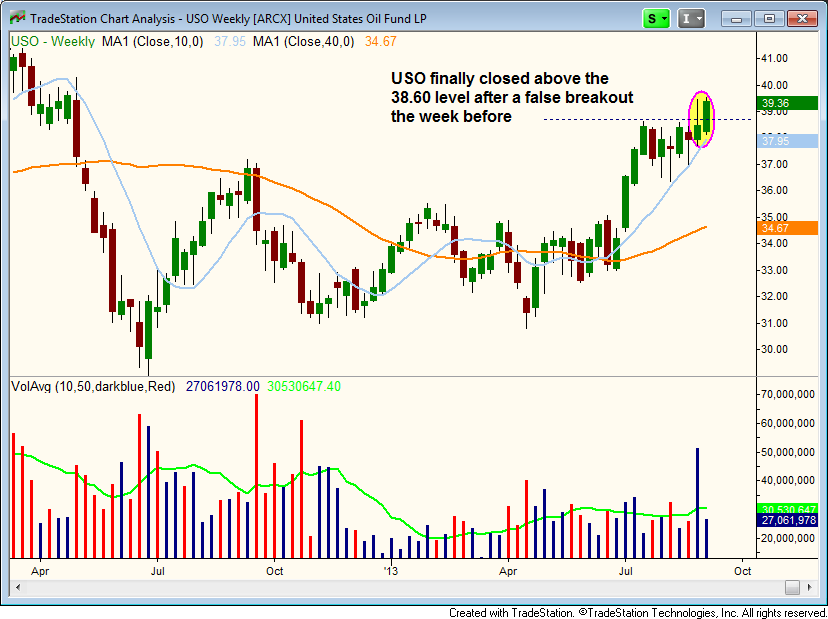
On false breakouts, strong stocks or ETFs should bounce back quickly after the initial shakeout has run its course (typically within 3-6 days). This is exactly what what happened in $USO last week, as it sold off to the 20-day EMA in four sessions and closed closed back above the 38.60 level last Friday.
We were busy on the ETF side last Friday, adding to positions in $FCG and $TAN, while establishing a new long position in $IEO.
On the stock side, we bought $TQNT on the open. $YELP has really taken off the past few days and is now up about 23% from our entry point. We moved the stop up to breakeven, but we will look to lock in partial gains if the price action is unable to hold above the rising 10-day MA.
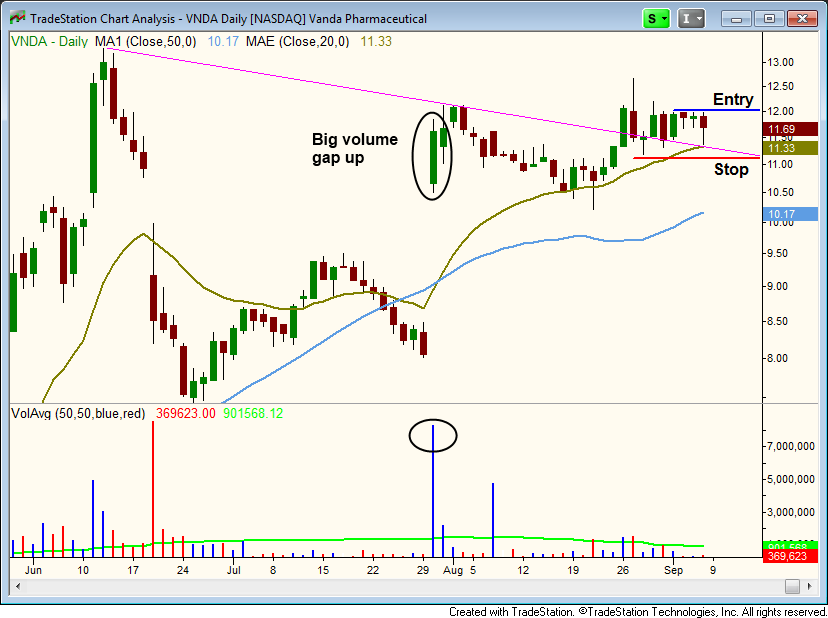
We have two new setups tonight ($SSNC and $VNDA), in addition to the $SGMO buy setup which remains live.
$SSNC has an 88 RS ranking and a 99 EPS ranking, so it solid both technically and fundamentally. Since $SSNC has solid fundamentals, we will attempt to hold on to the position as long as we can, provided that the price action breaks out to new highs and holds above the 50-day MA.
$VNDA is in great shape after a huge gap up on big volume in late July, as it has basically chopped around in a tight range waiting for 20-day MA to catch up. Friday’s reversal candle presents us with a low risk entry point over the three-day high. We are looking for a quick pop in price (1 to 2 week hold), as it lacks fundamentals.
Note to all subscribers. If possible, please avoid buying official setups in pre-market trading. The idea is not to buy cheap, but to buy right. Always wait for the price to hit the entry point after the market has officially opened.