Current signal generated on close of July 11.
Portfolio exposure should at least be 75% to 100% long or more (if you can go on margin).
Past signals:
- Neutral signal generated on close of July 5
- Sell signal generated on close of June 24
today’s watchlist (potential trade entries):

Having trouble seeing the open positions graphic above? Click here to view it directly on your web browser instead.
open positions:
Below is an overview of all open positions, as well as a report on all positions that were closed only since the previous day’s newsletter. Changes to open positions since the previous report are listed in pink shaded cells below. Be sure to read the Wagner Daily subscriber guide for important, automatic rules on trade entries and exits. Click here to learn the best way to calculate your share size.

Having trouble seeing the open positions graphic above? Click here to view it directly on your web browser instead.
closed positions:

Having trouble seeing the closed positions graphic above? Click here to view it directly on your web browser instead.
ETF position notes:
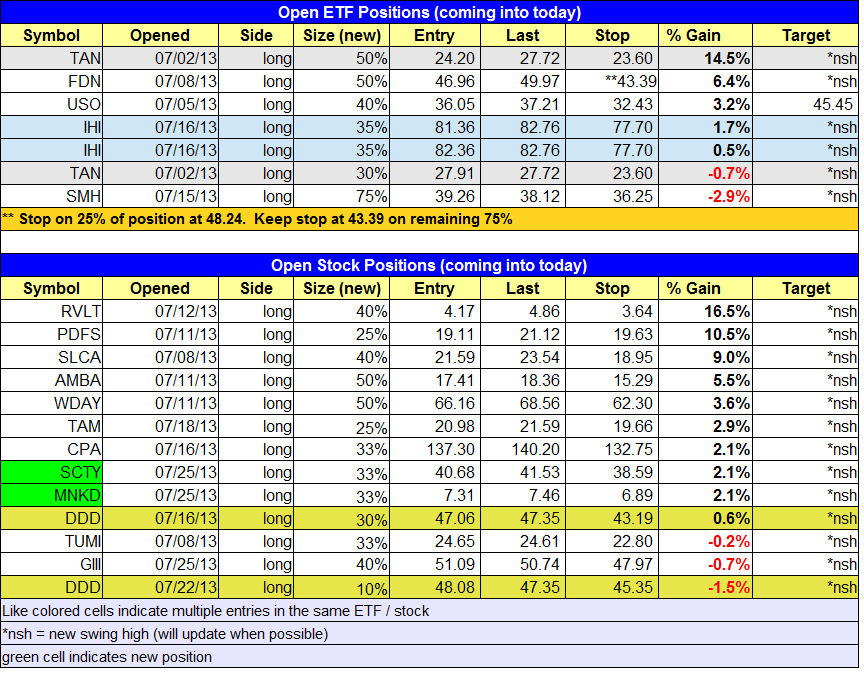
- No setups triggered
stock position notes:
- Bought $SCTY and $MNKD.
ETF, stock, and broad market commentary:
After trading lower throughout the first half of the day, stocks recovered in the afternoon to close flat to slightly higher. The blue-chip Dow Jones Industrial Average was unchanged, as the Nasdaq Composite tacked on 0.2%. The benchmark S&P 500 Index eked out a 0.1% gain. Turnover in both exchanges was approximately 17% lighter than the previous day’s levels, making for a quiet session overall. Nevertheless, it was bullish that the major indices brushed off early weakness and finished at their intraday highs.
The U.S. Oil Fund ETF ($USO) has pulled back to touch support of its 20-day exponential moving average for the first time since breaking out at the beginning of the month. This is shown on the daily chart below:

When an ETF or stock breaks out, the first retracement to the 20-day EMA usually presents a low-risk buying opportunity (as detailed in my book, Trading ETFs: Gaining An Edge With Technical Analysis). In this case, the buy setup is even more clearly defined because of the “hammer” type candlestick that formed last Friday. This allows traders to place a buy stop just above the July 26 high, while placing a tight protective stop below the intraday low (plus substantial “wiggle room”).
We are already long $USO from our original July 5 buy entry. However, as noted on today’s “watchlist,” we will add shares to our existing position on a rally above the July 26 high. We will be keeping a tighter stop on the added shares, while keeping a looser stop on the original position (since we are long from 3% lower than the current price). Subscribers who missed our initial entry for any reason may wish to take larger exposure than our partial shares added, but just be sure to respect risk by maintaining a stop within your predefined risk parameters.
Neither ETF trade setup on last Friday’s watchlist triggered for buy entry on July 26, as both $EWJ and $GSG failed to rally above their July 25 highs. However, both ETFs remain on our watchlist as we enter the new week and with adjusted buy trigger and stop prices (see the watchlist for details). $EWJ now offers an even more positive reward-risk ratio (if it triggers) because it has pulled back to close right at support of its 50-day moving average. $GSG “undercut” convergence of its 20 and 200-day moving averages and formed a bullish “hammer” candlestick pattern.
On the stock side, GIII triggered its buy entry but volume was below average. We’d like to see heavy volume come in to $GIII if/when it climbs above $52.00. $PDFS broke out to new highs on heavy volume. Our stop looks to be in the right spot, beneath the three day low.
$SCTY and $MNKD triggered buy entries last Friday. $MNKD followed through nicely on strong volume and should eventually break out above $8. The $10 area is our target for now.
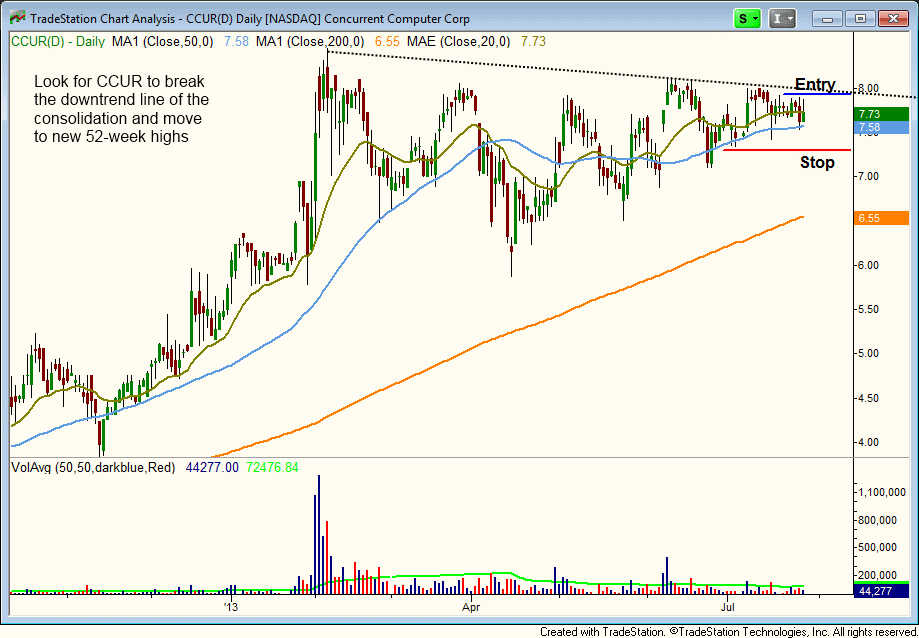
W$VRX remains on our watchlist, and we have added two new buy setups in $CCUR and $URI. $CCUR reports on 8/28 and $URI does not report until October.
United Rentals ($URI) is forming a cup and handle type pattern, and is currently in the handle phase of the pattern. $URI trades over 2 million shares a day, so it is very liquid and has great earnings and revenue quarter over quarter during the past two years. Our buy entry is on a slight pullback, just above the 50-day MA. If our entry holds, then we will look to add more shares on the way up. Since $URI is A rated, the goal is to hold on to the position as long as it remains above the 50-day MA.

Concurrent Computer ($CCUR) has been basing out since February and has really tightened up over the past months. Our buy entry is over the downtrend line with a stop just beneath the 4-week low. $CCUR is not an A rated stock, so we will look to sell at least partial size into strength on the move out.
