Buy Mode
– Timing model generated buy signal on close of March 5 (click here for more details)
today’s watchlist (potential trade entries):

Having trouble seeing the open positions graphic above? Click here to view it directly on your web browser instead.
open positions:
Below is an overview of all open positions, as well as a report on all positions that were closed only since the previous day’s newsletter. Net P/L figures are based on two separate $50,000 model portfolios (one for ETFs and one for stocks). Changes to open positions since the previous report are listed in pink shaded cells below. Be sure to read the Wagner Daily subscriber guide for important, automatic rules on trade entries and exits.

Having trouble seeing the open positions graphic above? Click here to view it directly on your web browser instead.
closed positions:

Having trouble seeing the closed positions graphic above? Click here to view it directly on your web browser instead.
ETF position notes:
- No trades were made. Canceled $IHI buy setup.
stock position notes:
- $SWFT buy setup did not trigger due to the 5-minute rule. We are cancelling the $SWFT buy setup to add and the $GEOS buy entry. We plan to close $DHI on the open.
ETF, stock, and broad market commentary:
Stocks opened higher but reversed sharply through the morning session, with most averages falling at least 1.0% off the highs of the day by 1 pm. Buyers stepped in once again in the afternoon, allowing the averages to close off the lows of the session with losses in the -0.3% to -0.5% range. The afternoon bounce prevented the averages from suffering a full day of selling (a trend day to the downside), which would have been ugly. However, volume did pick up on the NYSE, generating a second distribution day in the S&P 500 in the past five sessions. The distribution count now sits at four days for the S&P 500. Whenever the count is at four or more days the odds of a market entering a corrective phase increases.
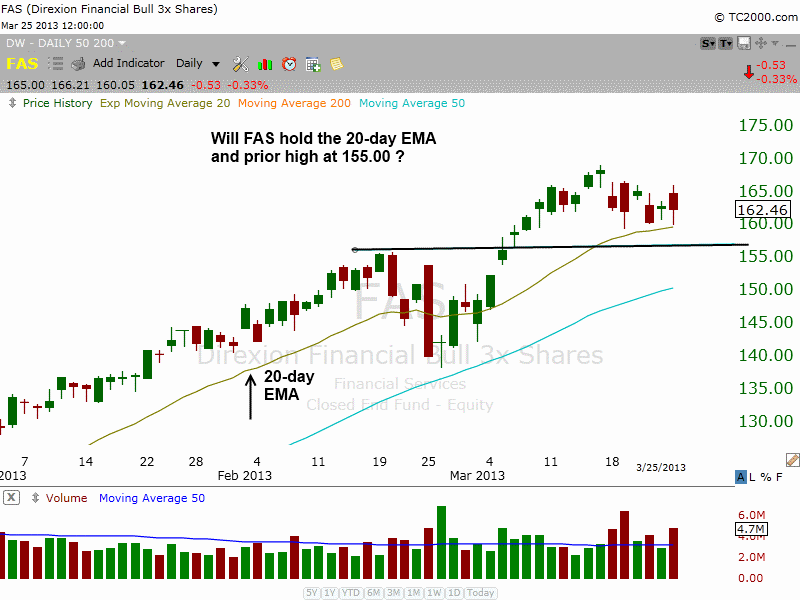
Transports, financials, and energy stocks have shared the leadership role during the current rally in the S&P 500. While Energy ETFs like $XLE are currently not extended, transports and financials are, but the Direxion Daily Financial Bull 3X ($FAS) is still in good shape, forming a bull-flag type pattern on the daily chart below.

Generally speaking, if the left side of a bull flag pattern takes two weeks or less to form, then the right side (the flag) should breakout within two weeks. The bull flag is a continuation pattern, so if the right side of the flag takes more than two weeks to move out then the stock or ETF will probably need several more weeks of base building before it is ready to go. $FAS has support from the prior high at 155.00 and the rising 20-day EMA at 160.00. A clear breakdown below the 20-day EMA could lead to a pullback to the 50-day MA, which is around 150.00.
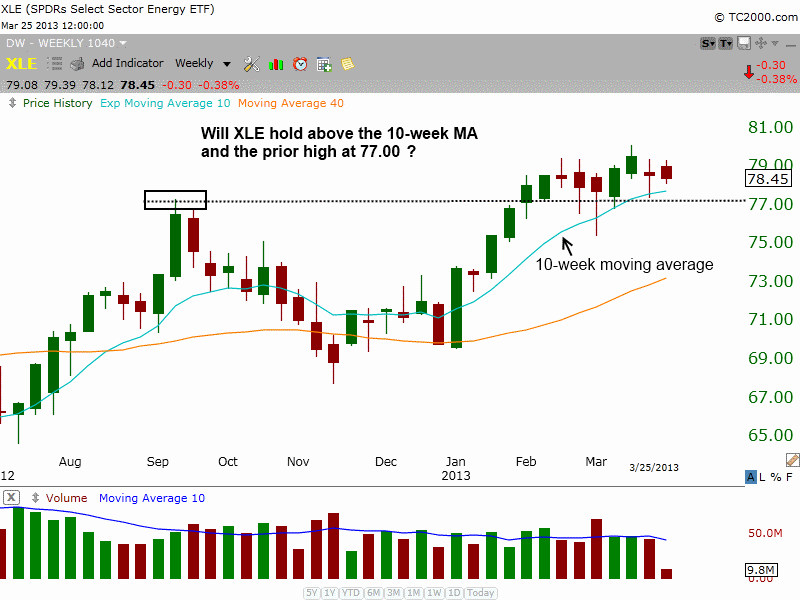
After clearing the highs of the last base at 77.00 in February, the Energy Select Sector SPDR ($XLE) has formed a tight eight-week base above the rising 10-week MA. If the market rally is to continue, then money will have to flow out of extended groups and into those that have been basing out for a few weeks, like the homebuilders ($ITB) and $XLE. There is quite a bit of support at 77.00, so this level should hold if $XLE is to breakout within the next few weeks.

On the stock side, we raised the stop in $HCA to just below breakeven, expecting the 20-day EMA and the last swing low on 3/18 to hold. The volume in $HCA has not been impressive, but we will continue to hold as long as it prints higher swing lows (and the S&P 500 avoids a 5th distribution day).
$SWFT recovered nicely off the lows of the day. Because the morning gap up ran more than 1.3% above our trigger within the first five minutes of trading, the buy setup to add shares was canceled. We are not going to add to the position, but we are raising the stop to just below the lows of the past two bullish reversal candles.
We selling $DHI at market on the open to limit our losses as we do not like the price and volume action since the breakout. If the homebuilders do hold up, then we might be able to re-enter within the next day or two with a pullback entry in $MTH or a breakout in $HOV.
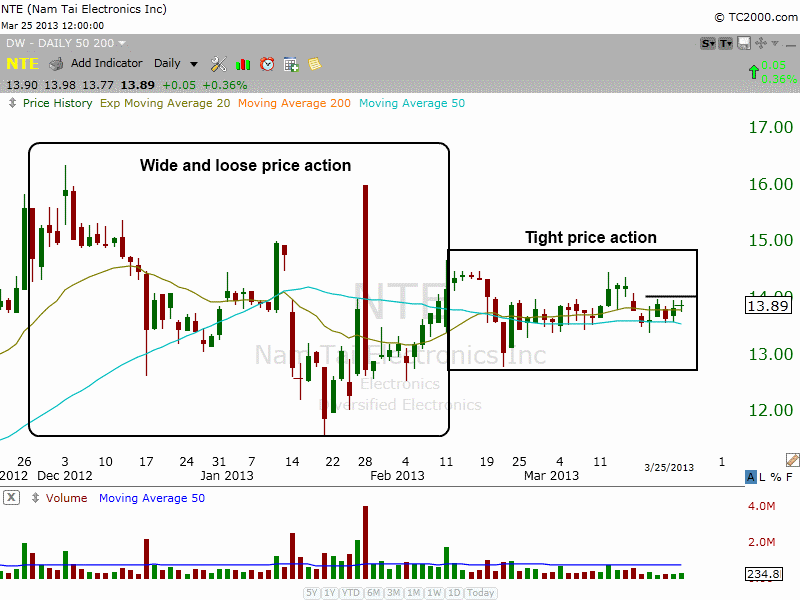
We canceled the $SWFT add and buy setup in GEOS, but $NTE buy setup remains official. We lowered the share size in $NTE and added a few cents to the trigger price. Rather than completely giving up on the rally, we are willing to hold on to a few positions with small share size. The daily chart of $NTE below shows how nicely the price action has tightened during the past two months.

relative strength combo watchlist:
Our Relative Strength Combo Watchlist makes it easy for subscribers to import data into their own scanning software, such as Tradestation, Interactive Brokers, and TC2000. This list is comprised of the strongest stocks (technically and fundamentally) in the market over the past six to 12 months. The scan is updated every Sunday, and this week’s RS Combo Watchlist can be downloaded by logging in to the Members Area of our web site.