Current signal generated on close of November 13.
Portfolio exposure can be anywhere from 25% to 50% long. If positions are holding up well, then one can add exposure beyond 50%.
Past signals:
- Neutral signal generated on close of November 6.
- Buy signal generated on close of September 9
- Neutral signal generated on close of August 15
- Buy signal generated on close of July 11
- Neutral signal generated on close of July 5
- Sell signal generated on close of June 24
today’s watchlist (potential trade entries):

Having trouble seeing the open positions graphic above? Click here to view it directly on your web browser instead.
open positions:
Below is an overview of all open positions, as well as a report on all positions that were closed only since the previous day’s newsletter. Changes to open positions since the previous report are listed in pink shaded cells below. Be sure to read the Wagner Daily subscriber guide for important, automatic rules on trade entries and exits.

Having trouble seeing the open positions graphic above? Click here to view it directly on your web browser instead.
closed positions:

Having trouble seeing the closed positions graphic above? Click here to view it directly on your web browser instead.
ETF position notes:
- No trades were made.
stock position notes:
- $FB buy setup triggered.
ETF, stock, and broad market commentary:
Following through on Friday’s late selling action, stocks sold off in the morning and once again in the afternoon, as all major averages closed in negative territory.
The Mid-cap S&P 400 held up best, shedding less than 0.1% on the day. The small cap Russell 2000 was hit the hardest, closing 1.2% lower. The broad based averages do look vulnerable to a short-term pullback, with the exception of the S&P 400, which has been in consolidation mode since the end of October.
Turnover increased but that was expected due to Friday’s early close. Monday’s volume in the NASDAQ was lighter than the 50-day volume moving average, and lighter than volume during the rally from 11/21 to 11/26. So we would not view yesterday’s selling in the NASDAQ Composite as distribution.
NYSE volume was also lighter than its 50-day volume moving average, but was more significant than NASDAQ volume, as volume was on par with prior distribution days on 11/18 and 11/19. Even if we were to label Monday as a distribution day in the S&P 500, it would be a mild one with only a -0.3% loss.
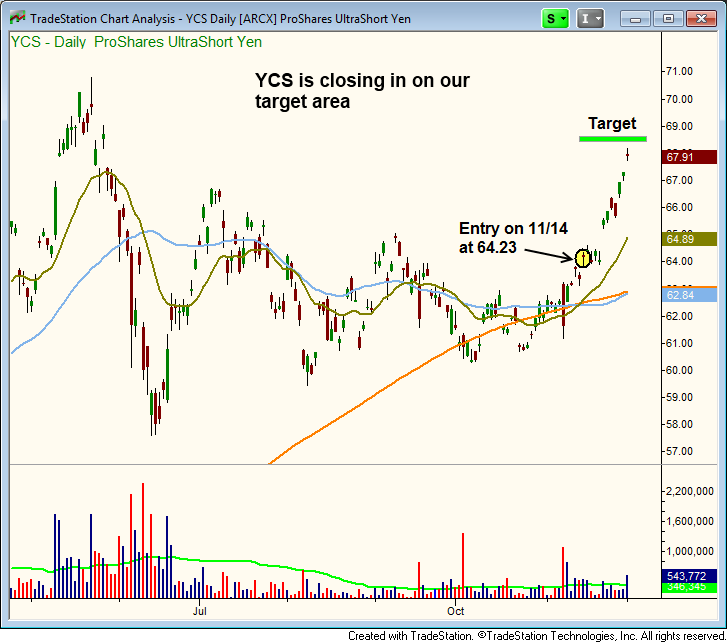
On 11/14, we established a short position in the Yen by going long ProShares UltraShort Yen ($YCS). Since then, our entry has climbed steadily higher and is now approaching our target area. Our target is listed in the open positions section above.
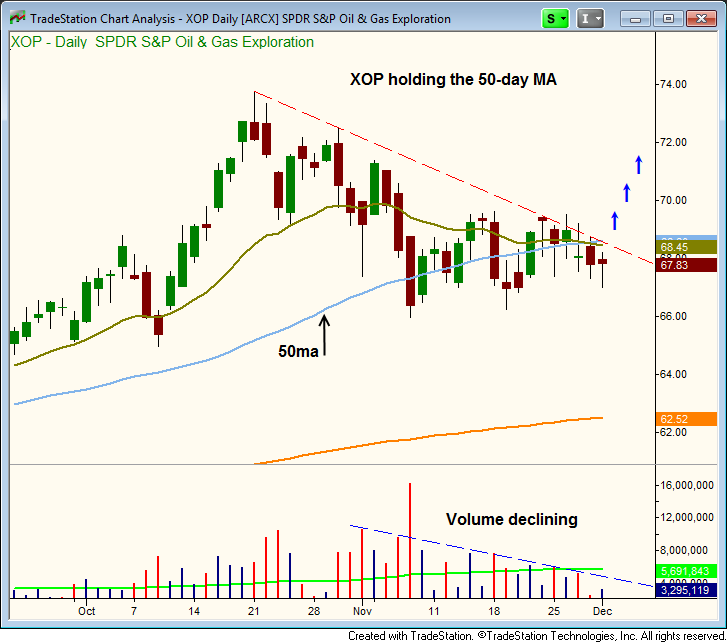
After pulling back in about 10% off the swing high, SPDR S&P Oil & Gas Exploration & Production ETF ($XOP) found support at the 50-day MA, where it has since consolidated in a tight range.
The 50-day moving average has remained in an uptrend through the basing action. The 10-day moving average is currently below the 50-day MA, but it has stopped making lower lows the past few weeks.
$XOP has established one higher swing low within the base on 11/19 and potentially a second higher swing low if Monday’s low can hold. It will be important for $XOP to close above the 50-day MA, as this would also result in a break of the daily downtrend line.
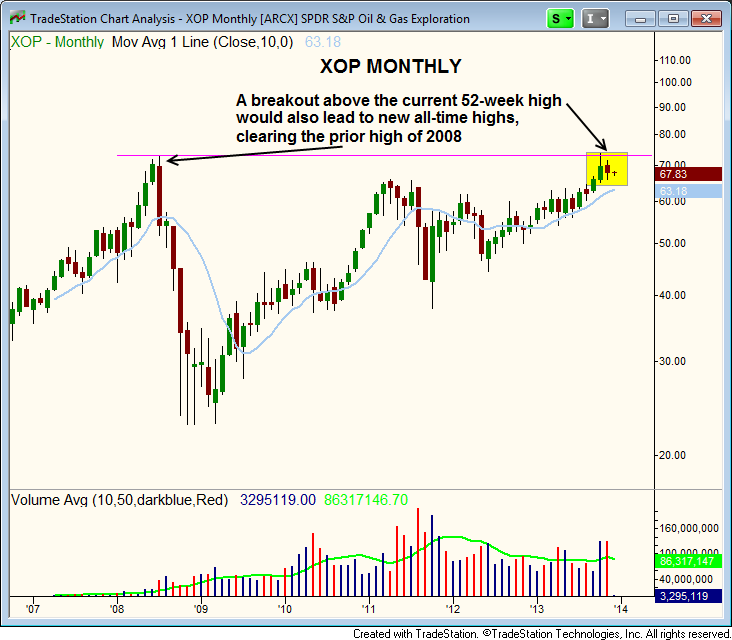
If $XOP can break out to new 52-week highs in the next few weeks, it would also result in a move to new all-time highs, breaking the prior high from 2008. So this is a potential breakout setup on multiple time frames.
$FB triggered its buy entry yesterday with a move above last week’s high. We are not expecting the action to rocket higher from here, as we plan to let the base develop and slowly add to the position as higher, low risk entry points emerge.
$BLMN was removed from today’s watchlist, but we will continue to monitor the action for a bullish reversal candle ($BLMN could be back on the watchlist tomorrow).
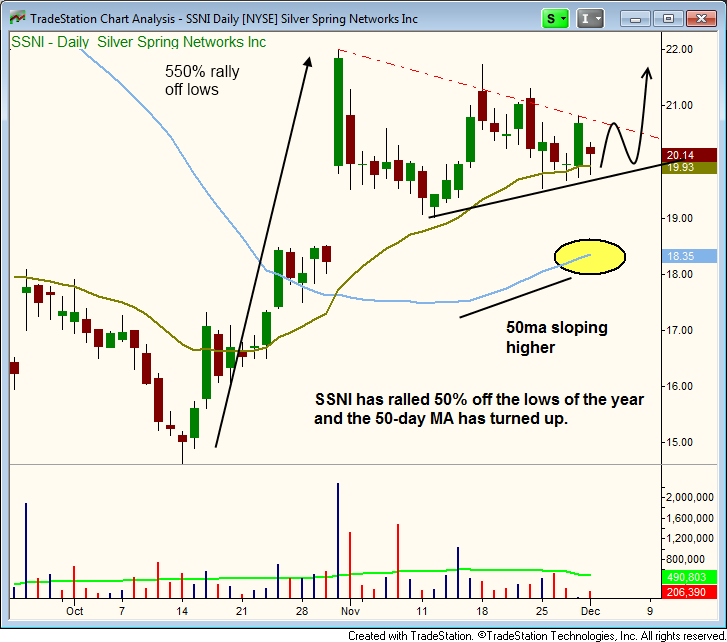
There are no new setups today, but we are monitoring $SSNI, a fresh IPO that has rallied about 50% off the lows and is currently basing out.
We plotted the ideal price action over the next few days on the chart below.