Current signal generated on close of November 13.
Portfolio exposure can be anywhere from 25% to 50% long. If positions are holding up well, then one can add exposure beyond 50%.
Past signals:
- Neutral signal generated on close of November 6.
- Buy signal generated on close of September 9
- Neutral signal generated on close of August 15
- Buy signal generated on close of July 11
- Neutral signal generated on close of July 5
- Sell signal generated on close of June 24
today’s watchlist (potential trade entries):

Having trouble seeing the open positions graphic above? Click here to view it directly on your web browser instead.
open positions:
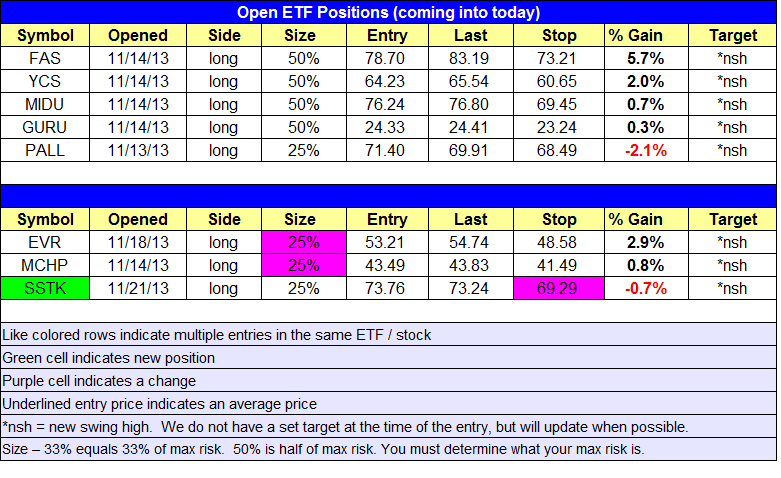
Below is an overview of all open positions, as well as a report on all positions that were closed only since the previous day’s newsletter. Changes to open positions since the previous report are listed in pink shaded cells below. Be sure to read the Wagner Daily subscriber guide for important, automatic rules on trade entries and exits.
Having trouble seeing the open positions graphic above? Click here to view it directly on your web browser instead.
closed positions:

Having trouble seeing the closed positions graphic above? Click here to view it directly on your web browser instead.
ETF position notes:
- No trades were made.
stock position notes:
- Bought $SSTK. Sold partial size in $EVR and $MCHP.
ETF, stock, and broad market commentary:
After a few days of weakness, stocks rallied higher across the board with impressive gains of 1.8% in the small-cap Russell 2000 and 1.2% in the NASDAQ Composite. Although the price action was strong, volume failed to confirm the move in the NASDAQ, as turnover was slightly lower than Wednesday.
After a few weeks of relative weakness, the Russell 2000 is in position to set new highs for the year. The same can be said for the NASDAQ, but there is psychological resistance at 4,000.
While the broad based averages remain in a solid uptrend, the majority of leading stocks continue to lag, with just a handful breaking out to new highs the past few weeks. Because of this, we will continue to take shots on the ETF side while remaining a bit more cautious with stocks.
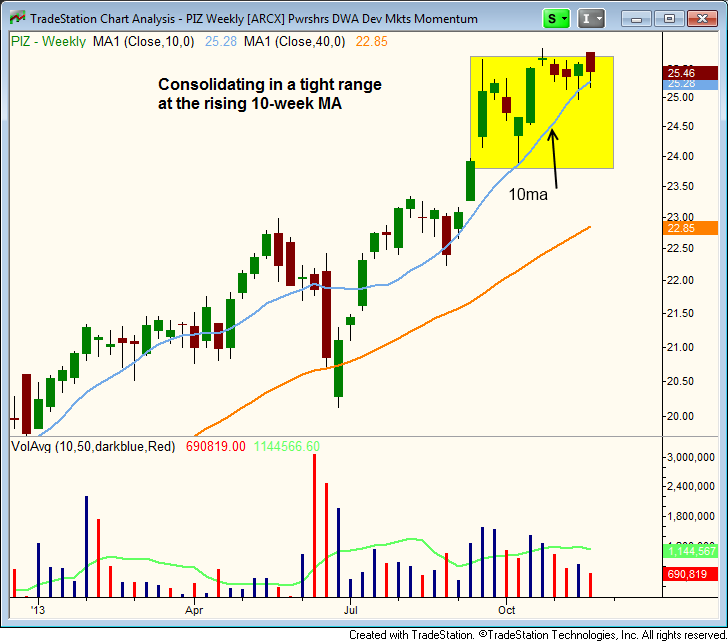
PowerShares DWA Developed Markets Momentum Portfolio ($PIZ) has tightened up nicely over the past few weeks, holding support of the 10-week MA.
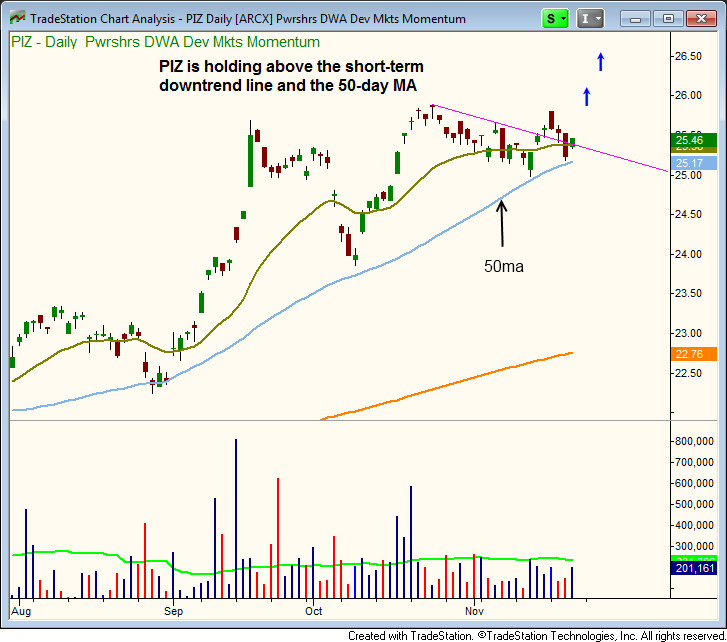
The daily chart show the price action breaking above the short-term downtrend line last Friday, and pulling back to that line this week, which we call testing the backside of a downtrend line. A breakout above the current range highs could potential lead to a breakout above all-time highs at 26.90 from 2008. Our detailed entry, stop, and target prices are listed in today’s watchlist above.
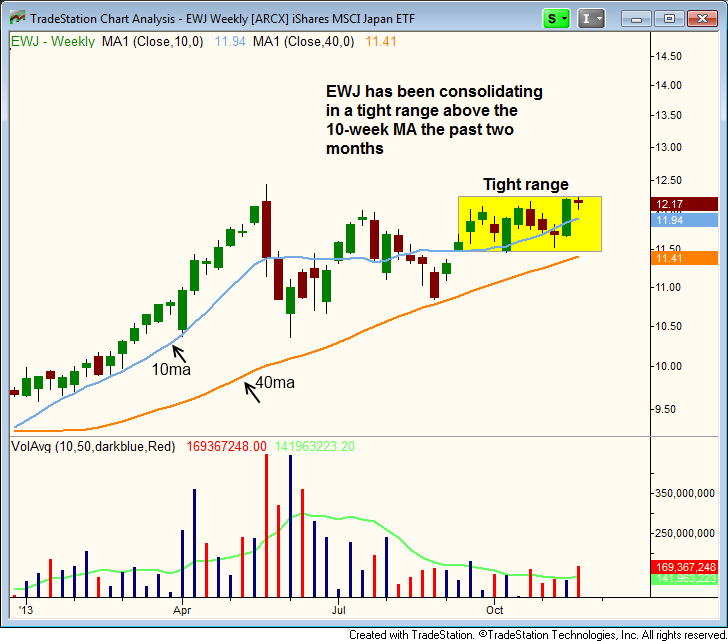
The weekly chart of iShares MSCI Japan Index ($EWJ) still looks good, as it has been tightening up for a few months just below the highs of last May. A breakout above last week’s high could lead to new 52-week highs and spark a move to the $14 area on the monthly chart. Trade details can be found in the watchlist section above.
On the stock side, we sold down our two long positions in $EVR and $MCHP to 25%. Both stocks produced solid gains yesterday and set new closing highs for the year, but volume was disappointing.
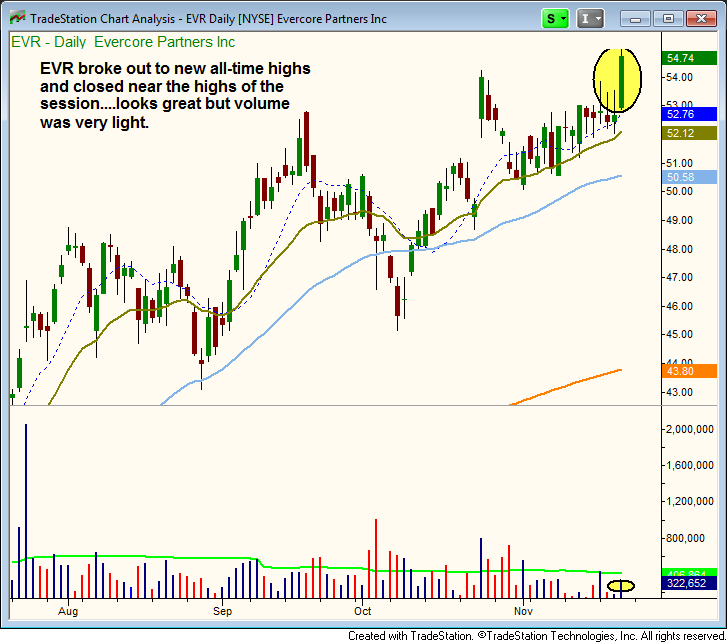
Big volume at a key breakout level usually indicates that a stock is ready to stage a multi-month advance. The light volume breakout in $EVR doesn’t mean the the setup will fail, but it does suggest that the move out may be sluggish.
$SSTK triggered a buy entry yesterday, but stalled out after the initial surge. Volume was light here as well, but the hourly chart remains intact and could run higher within the next few days.
As mentioned above, we plan to play it a bit more slow on the stock side…for now. Patience is key as we wait for the right stocks to set up properly.