market timing model: BUY
Current signal generated on close of November 13.Portfolio exposure can be anywhere from 25% to 50% long. If positions are holding up well, then one can add exposure beyond 50%.Past signals:
- Neutral signal generated on close of November 6.
- Buy signal generated on close of September 9
- Neutral signal generated on close of August 15
- Buy signal generated on close of July 11
- Neutral signal generated on close of July 5
- Sell signal generated on close of June 24
today’s watchlist (potential trade entries):

Having trouble seeing the open positions graphic above? Click here to view it directly on your web browser instead.
open positions:
Below is an overview of all open positions, as well as a report on all positions that were closed only since the previous day’s newsletter. Changes to open positions since the previous report are listed in pink shaded cells below. Be sure to read the Wagner Daily subscriber guide for important, automatic rules on trade entries and exits.

Having trouble seeing the open positions graphic above? Click here to view it directly on your web browser instead.
closed positions:

Having trouble seeing the closed positions graphic above? Click here to view it directly on your web browser instead.
ETF position notes:
- No trades were made.
stock position notes:
- Note that we are selling down our share size in open positions to 25%.
ETF, stock, and broad market commentary:
The S&P 500 sold off for the third day in the row, finishing 0.4% lower on lighter volume and closing at support from the rising 10-day moving average. If the 10-day MA is unable to hold, then there is support from the prior breakout level and rising 20-day EMA in the $177 to $177.50 area.
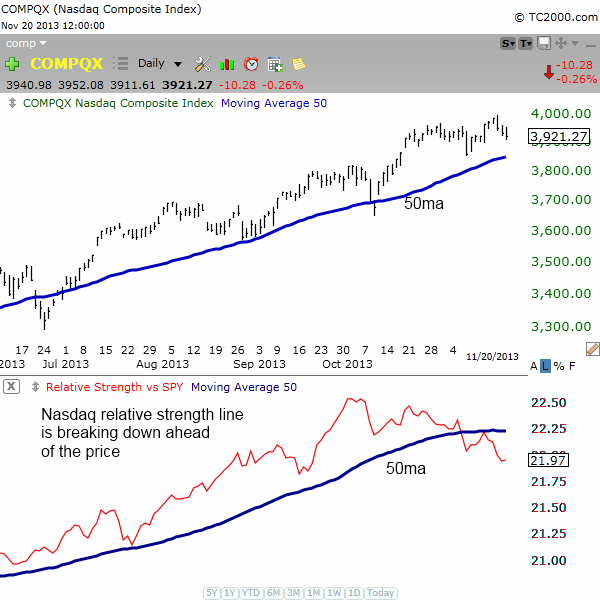
The NASDAQ Composite, which has been relatively weak vs the S&P and Dow is already at support from the 10 and 20-day MAs. If this level is unable to hold, then the next logical support area is the 50-day MA, which lines up with the prior swing low from November 7.
The weakness in leading stocks over the past few weeks suggests the NASDAQ is vulnerable to a short-term selloff to the 50-day MA (exactly when we do not know).
The chart below shows the NASDAQ’s relative strength line vs the S&P 500. The RS line is already below the 50-day MA (while price of NASDAQ is still above), and has also made two lower highs and two lower lows, signaling a trend reversal in relative strength.
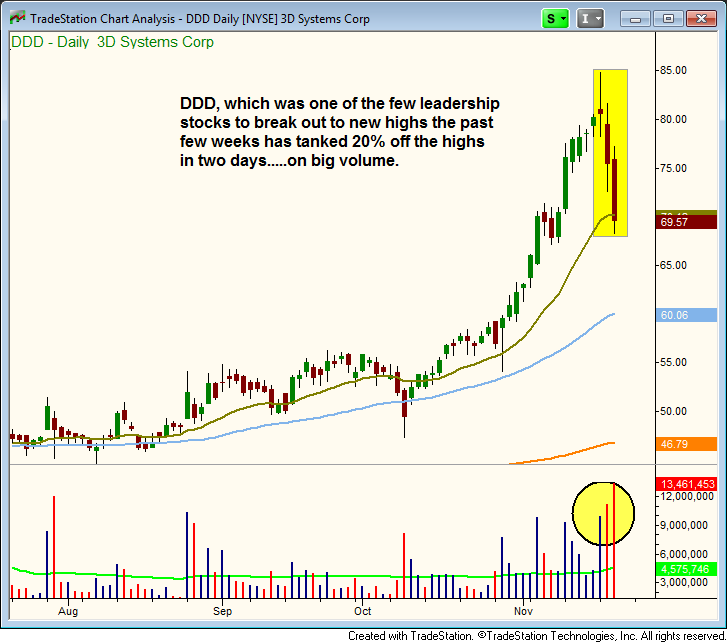
Leading stock $DDD has been hit hard the past two days after a strong breakout. $DDD was one of the few leadership stocks to break out to new highs the past few weeks. $DDD has dropped 20% in two sessions, and at this point, anyone who has not already sold is praying for a bounce to get out. Not good action!
The fact that leadership stocks have failed to produce quality buy setups as of late suggests that the market may be headed for a few weeks of choppy action. If the majority of stocks find support over the next few weeks and begin to put in higher lows within a base, then the market may be able to push higher in Q1-2014. However, if leading stocks begin to crumble in numbers, then the market could be vulnerable to a sharp selloff, somewhere in the 6% to 10% range off the current highs.
ProShares UltraShort Lehman 20+ Yr ($TBT) looks to be resuming its new uptrend after a three-month break, as yesterday’s strong advance was confirmed by heavier than average volume.
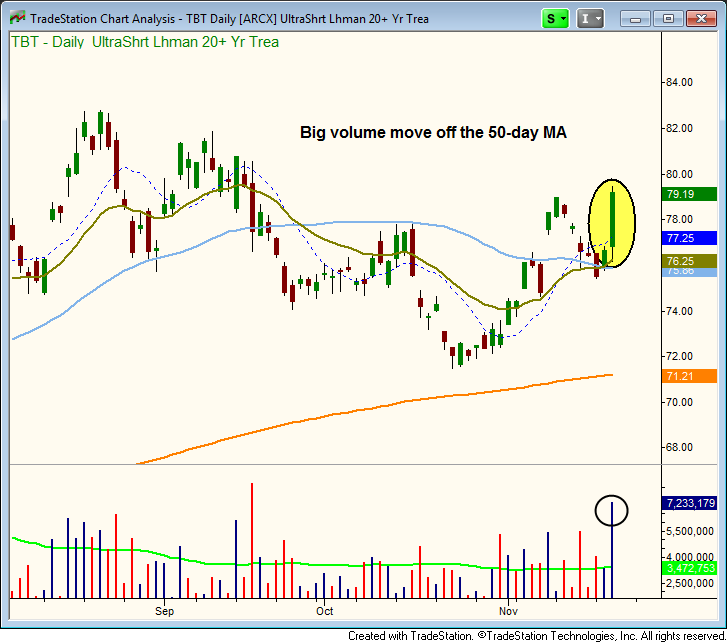
The bullish surge off the 50-day MA is a buy signal, so we are monitoring $TBT for a low risk pullback entry within the next 3 to 10 days to the rising 10-day MA. The 50-day MA has just flattened out and has yet to turn up, but the 20-day EMA is now above the 50-day AM, so all three averages are in proper order (20>50>200).
On the stock side we are playing it very conservatively, as we plan to sell our $MCHP and $EVR positions down to 25% size on the open. We do not like the way leading stocks have responded the past few weeks, so we are making a judgment call to take some risk off the table.
A few months ago we were heavily long and there were plenty of setups to buy, but market conditions have changed the past few weeks, and there simply isn’t much to do right now.
When there isn’t much to do we go into S.O.H. mode (S.O.H. stands for sit on hands). Sometimes it is best to do nothing, as buying with little or no conviction can lead to over-trading, which basically happens when a bunch of small losses adds up to one big loss.