market timing model:
Confirmed Buy – Signal generated on the close of September 4 (click here for more details) (we are on a buy signal from the close of Aug. 16)
today’s watchlist (potential trade entries):
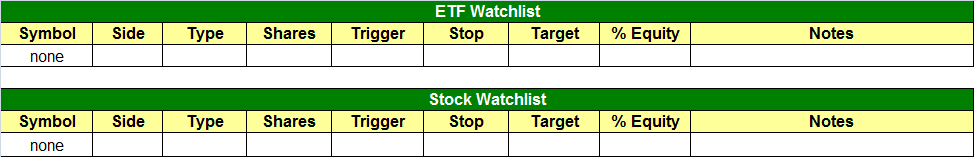
Having trouble seeing the open positions graphic above? Click here to view it directly on your web browser instead.
open positions:
Below is an overview of all open positions, as well as a report on all positions that were closed only since the previous day’s newsletter. Net P/L figures are based on two separate $50,000 model portfolios (one for ETFs and one for stocks). Changes to open positions since the previous report are listed in pink shaded cells below. Be sure to read the Wagner Daily subscriber guide for important, automatic rules on trade entries and exits.
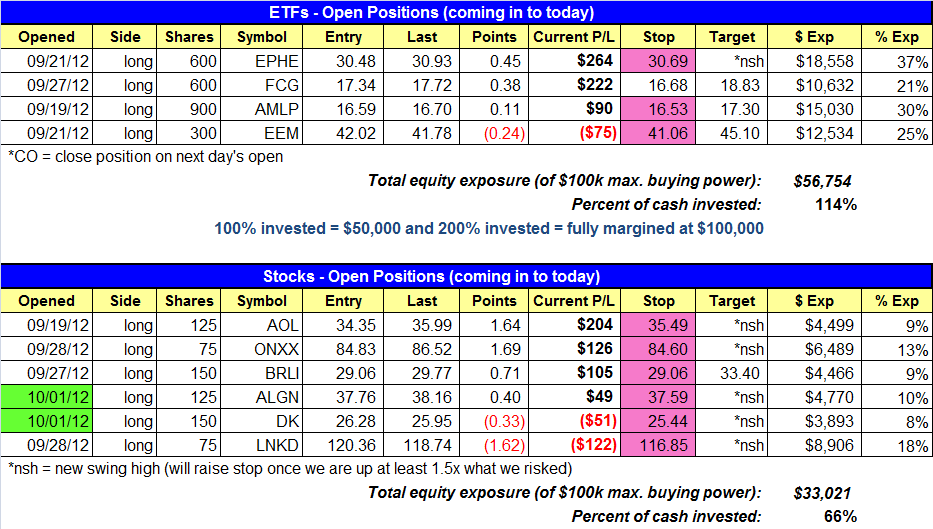
Having trouble seeing the open positions graphic above? Click here to view it directly on your web browser instead.
closed positions:
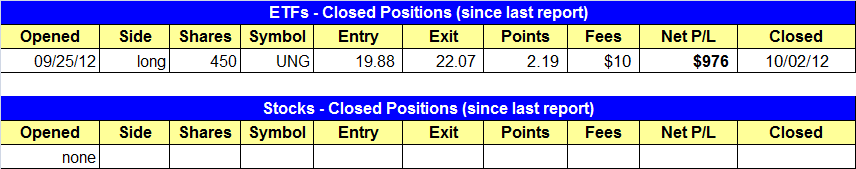
Having trouble seeing the closed positions graphic above? Click here to view it directly on your web browser instead.
ETF position notes:
- Sold UNG to lock in a strong gain. Note the new stop prices above.
stock position notes:
- Note the new stop prices above.
ETF and broad market commentary:
After gapping higher on the open, stocks drifted lower throughout most of the day, but buying interest in the final hour of trading enabled the major indices to recover most of the intraday decline and finish with mixed results. The Nasdaq Composite ($COMPX) gained 0.2% and the S&P 500 ($SPX) edged 0.1% higher, but the Dow Jones Industrial Average showed relative weakness by settling 0.2% lower. The small-cap Russell 2000 Index ($RUT) was unchanged, while the S&P Midcap 400 Index rose 0.3%. The main stock market indexes closed in the upper half of their intraday trading ranges.
Total volume in the NYSE receded 5%, as turnover in a Nasdaq registered 11% lighter than the previous day’s level. Although trade was light, market internals were decent considering the intraday price action. In the Nasdaq, advancing volume exceeded declining volume by nearly 2 to 1. The NYSE ADV/DEC volume ratio was flat. In both exchanges, turnover limped in below 50-day average levels. It was the first time that total volume in the Nasdaq was lighter than average since September 17. With earnings season kicking off this week, banks, mutual funds, hedge funds, and other institutions were interested in being on the sidelines until quarterly earnings report start coming in.
If you have just signed up for our Wagner Daily newsletter within the past two weeks, we would like you to realize the broad market has already made an extended run, and we have already booked some nice winning trades in recent weeks (you can view our Q3 trade performance details here). Because the stock market has been in pullback mode lately, our open positions have not gained as much ground as they did last month. When this occurs and our positions do not act as expected, we definitely take notice and proactively attempt to reduce risk by raising our protective stops and/or reducing share size. During periods of market transition or indecision, it is crucial to proactively do something with trades that are not moving much, rather than simply trading with blinders on.
Yesterday, we sold our position in US Natural Gas Fund ($UNG) for a nice gain of 11% (nearly $1,000 based on our $50,000 model ETF trading account). In today’s ETF analysis and commentary, we will do an educational technical review of the trade setup, walking you through from the date of our buy entry to the date of our sale. Although one could simply follow the exact entry and exit points of our ETF picks every day, without worrying about the methodology behind the trade setups, having a clear understanding of our ETF trading strategy will enable one to ultimately become a more successful swing trader by having more belief and confidence in our trading system.
The UNG trade setup was originally presented to subscribers in the September 24 issue of The Wagner Daily. On that day, we presented exactly the following commentary and chart of UNG (presented in blue text):
Unlike our stock trading strategy, which focuses primarily on Breakouts and Pullbacks in uptrending markets, we afford ourselves a bit more diversity with our ETF trading strategy because we also seek to take advantage of ETFs reversing from downtrends. This is particularly true with ETFs that have a low correlation to the direction of the broad market, such as currency, commodity, fixed income, and international ETFs. One ETF we are stalking for potential short-term buy entry now is U.S. Natural Gas Fund ($UNG). The technical analysis of the trade setup is shown on the daily chart below:

For trend reversal plays, we typically wait several months after the ETF has formed a significant low, which enables the 20, 50, and 200-day moving averages to each be trending higher and above one another. Buying before that happens often leads to a negative result. However, in the case of UNG, a very important factor driving this setup is the close proximity of the 200-day moving average.
As a long-term indicator of trend, the 200-day moving average usually acts as a brick wall. If an ETF or stock is trying to move above that resistance level, it typically requires at least several attempts. However, when the breakout above the 200-day MA eventually happens, it is normally quite powerful, at least in the near-term.
In the case of UNG, notice it has already pulled back after several attempts to break the 200-day MA, but has formed a ‘higher low’ each time in the process. Odds of a breakout above the 200-day MA are increased after several ‘higher lows’ have already been formed, as is the case with UNG. If it convincingly rallies above its 200-day MA on this attempt, it will probably move sharply higher in the near-term. However, because this ETF is well off its 52-week high, it is NOT a trade setup we want to hold for the long-term. Rather, this is intended to be a very quick, momentum-based “pop” above the 200-day MA. Estimated holding time if it triggers for buy entry is only 2 to 5 days.
That day, we added UNG to our “official” ETF watchlist as a potential trade entry. Trading in a tight range on September 24, UNG did not trigger our buy entry. However, the trade setup remained on our watchlist the following day, and triggered our buy entry on September 25, as it rallied above its 200-day moving average. After it broke out above resistance that day, buyers immediately stepped in and bullish momentum propelled the ETF sharply higher for six consecutive days (and still counting). The current daily chart of UNG below shows the subsequent price action after our September 25 buy entry:

When we first explained the trade setup on September 24, we said our estimated holding time for the swing trade would be just 2 to 5 days because we were only looking for a “very quick, momentum-based ‘pop’ above the 200-day MA.” As you can see on the chart above, that is exactly what happened, as UNG rocketed to within just 15 cents of our original price target in 5 short days.
Because UNG came so close to hitting our target on October 1, we notified subscribers that we would be selling UNG at market on yesterday’s (October 2) open. Gapping slightly lower on the October 2 open, we sold UNG at $22.07 in our model ETF trading account, locking in a solid 11% gain with a holding period of 6 days. Although UNG reversed higher yesterday and actually went on to trade through our original price target of $22.58 later in the day, we have absolutely no regret for making the decision to sell on the open, which turned out to be 51 cents lower than the price target. Given that the ETF exploded higher for five straight days after our buy entry, we were simply not willing to take the risk of UNG nearly hitting our price target, but then immediately pulling back substantially. Remember that our original plan was to sell the quick, momentum-based pop, without holding through an eventual and inevitable pullback.
As you probably know, we follow a disciplined, rule-based trading system, but a bit of common sense and discretion is often required. Many traders, particularly newer ones, make the mistake of getting greedy, or letting their ego rule their decision making process, which often results in a highly profitable trade turning into a moderately profitable trade (or worse). We hope you found this review of the UNG swing trade to be informative, as well as a good reminder of a key psychological aspect of successful trading.
Even though we have closed this trade, UNG could still move much higher in the intermediate-term. The rally over the past week was a breakout above a valid base of consolidation, which could set into motion a new intermediate-term uptrend for this ETF. As such, UNG is now on our radar screen for potential re-entry after it either pulls back or forms a bull flag chart pattern. There is a good chance we will be able to re-enter the trade at a slightly lower price, or possibly near the current price, but with a more positive reward to risk ratio after UNG undergoes at least a near-term correction.
As you probably know, we follow a disciplined, rule-based trading system, but a bit of common sense and discretion is often required. Many traders, particularly newer ones, make the mistake of getting greedy, or letting their ego rule their decision making process, which often results in a highly profitable trade turning into a moderately profitable trade (or worse). We hope you found this review of the UNG swing trade to be informative, as well as a good reminder of a key psychological aspect of successful trading.
stock commentary:
The market has been quite resilient the past two days by selling off on light volume and avoiding distribution. Our distribution count sits at three days on the Nasdaq, so our timing model remains in buy mode. That being said, we have not seen a strong day of accumulation in a major average in a little over two weeks (not since 9/13). Furthermore, the lack of bullish price action in the 300 or so top relative strength stocks we follow is a concern. Because of this we are raising the stops in current open positions to reduce our overall risk. If the market chops around for a few days, then open positions in ONXX, BRLI, and AOL could continue to run higher. However, if the market decides to take another leg down, then our stops will keep us out of serious trouble.
There are no new official setups for today, but here are the top stocks on our internal watchlist:
- AIRM DORM ARRY PKT RGR NTE.
If you are a new subscriber, please e-mail [email protected] with any questions regarding our trading strategy, money management, or how to make the most out of this report.
relative strength combo watchlist:
Our Relative Strength Combo Watchlist makes it easy for subscribers to import data into their own scanning software, such as Tradestation, Interactive Brokers, and TC2000. This list is comprised of the strongest stocks (technically and fundamentally) in the market over the past six to 12 months. The scan is updated every Sunday, and this week’s RS Combo Watchlist can be downloaded by logging in to the Members Area of our web site.