Confirmed Buy– The timing model was upgraded to a confirmed buy on the close of January 22. However, the initial buy signal was generated on the close of December 31. (click here for more details)
today’s watchlist (potential trade entries):

Having trouble seeing the open positions graphic above? Click here to view it directly on your web browser instead.
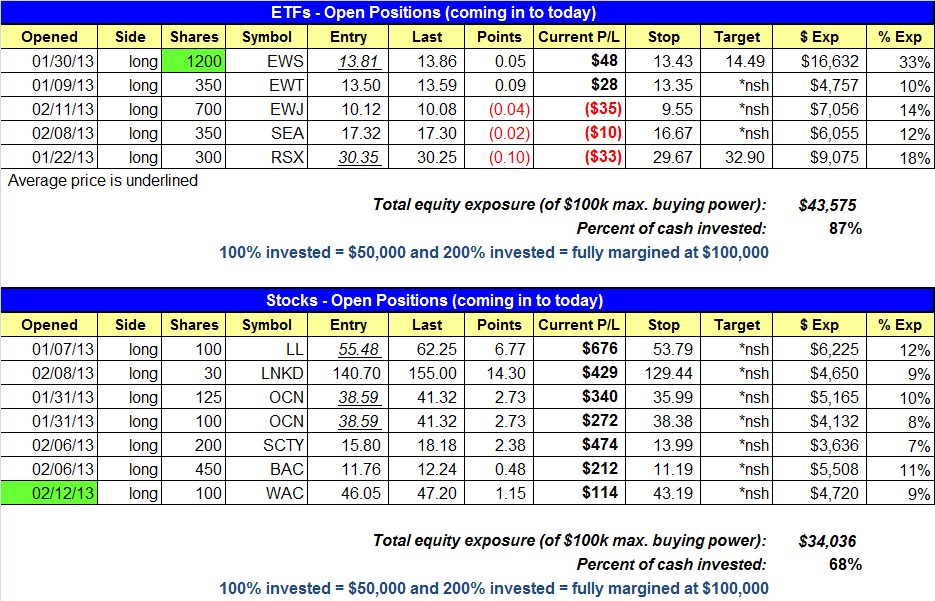
open positions:
Below is an overview of all open positions, as well as a report on all positions that were closed only since the previous day’s newsletter. Net P/L figures are based on two separate $50,000 model portfolios (one for ETFs and one for stocks). Changes to open positions since the previous report are listed in pink shaded cells below. Be sure to read the Wagner Daily subscriber guide for important, automatic rules on trade entries and exits.
Having trouble seeing the open positions graphic above? Click here to view it directly on your web browser instead.
closed positions:
Having trouble seeing the closed positions graphic above? Click here to view it directly on your web browser instead.
ETF position notes:
- $EWS buy entry to add to existing position triggered.
stock position notes:
- $WAC buy stop triggered.
ETF, stock, and broad market commentary:
All major averages closed in positive territory with modest gains except for the Nasdaq Composite, which closed slightly lower at -0.17%. We continue to see leadership from small and mid-cap stocks, which is a good sign for the health of the rally (small and mid-cap stocks failed to outperform the S&P 500 during rallies last year).
Turnover on the NYSE jumped by 25%, registering a bullish accumulation day for the S&P 500. Nasdaq volume increased by 13%, but the small loss did not qualify as distribution. The volume patterns remains bullish on the NYSE.
Our buy setup to add to an existing position in $EWS triggered on Tuesday. In the watchlist section above, we have a new buy setup to add to an existing position in $EWJ, with a tight stop.
We stopped out of $EPI last week just below break-even when it failed to hold the 20-day EMA. We still like the weekly and daily chart in $EPI; however, the charts of the iPath MSCI India ($INP) are showing a bit more relative strength, so we plan to re-enter India through $INP. Yes, $INP trades with lower volume, but its relative strength over the other ETFs is clear. $INP tested the highs of 2012 while $EPI stalled 5% short of the 2012 high.

The daily chart below details support at 60.00 from the prior breakout pivot and the 50-day MA. With $INP pulling back to the 50-day MA, we have a low-risk entry to establish partial size, with a stop below the 50-day MA, minus some wiggle room (about 2 ATRs below our entry). If the uptrend is to resume, $INP should hold the 50-day MA and work its way higher over the next few weeks.

On the stock side, $SCTY broke out to new highs on heavy volume. $SCTY trades at 18x its ATR ($18 share price and $1 ATR), which is huge for a small stock. The big ATR means that $SCTY has explosive potential, and could easily run 30-40% or more in a short period of time.
$QIHU remains on the watchlist from yesterday and is a must own stock. Like $LNKD, it has great relative strength and strong fundamentals. We like the tight price action and decline in volume at the 20-day EMA over the past few days. Our buy entry is over Tuesday’s high. We are keeping our share size small because $QIHU has earnings due sometime next week. Earnings is scheduled for Feb. 20, but it has yet to confirmed.

If you are a new subscriber, please e-mail [email protected] with any questions regarding our trading strategy, money management, or how to make the most out of this report.
relative strength combo watchlist:
Our Relative Strength Combo Watchlist makes it easy for subscribers to import data into their own scanning software, such as Tradestation, Interactive Brokers, and TC2000. This list is comprised of the strongest stocks (technically and fundamentally) in the market over the past six to 12 months. The scan is updated every Sunday, and this week’s RS Combo Watchlist can be downloaded by logging in to the Members Area of our web site.