market timing model:
Buy – Signal generated on the close of November 23 (click here for more details)
today’s watchlist (potential trade entries):

Having trouble seeing the open positions graphic above? Click here to view it directly on your web browser instead.
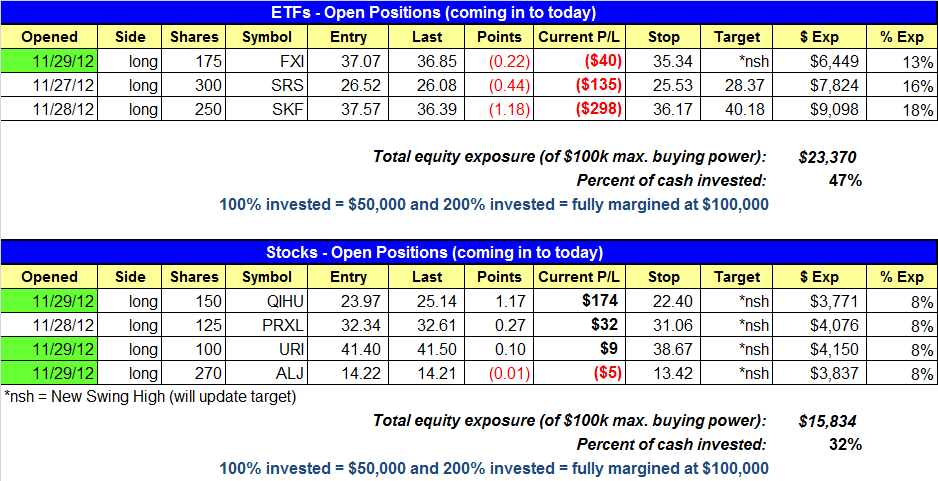
open positions:
Below is an overview of all open positions, as well as a report on all positions that were closed only since the previous day’s newsletter. Net P/L figures are based on two separate $50,000 model portfolios (one for ETFs and one for stocks). Changes to open positions since the previous report are listed in pink shaded cells below. Be sure to read the Wagner Daily subscriber guide for important, automatic rules on trade entries and exits.
Having trouble seeing the open positions graphic above? Click here to view it directly on your web browser instead.
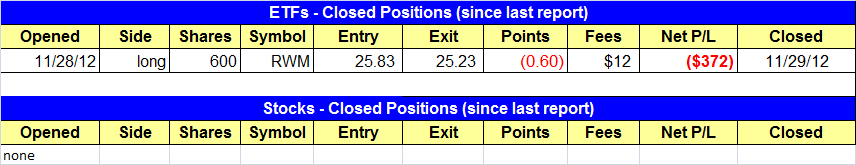
closed positions:
Having trouble seeing the closed positions graphic above?
Click here to view it directly on your web browser instead.
ETF position notes:
- RWM sell stop triggered and we are out.
stock position notes:
- QIHU, URI, and ALJ buy setups triggered. NTE buy limit order remains open.
ETF and broad market commentary:
Stocks continued building on their recent gains yesterday, as the Nasdaq finally started showing relative strength. The major indices gapped substantially higher on the open, dipped around noon, then stabilized and oscillated in a tight, sideways range throughout the rest of the session. Leading the way for a change, the Nasdaq Composite Index ($COMPQ) registered a solid advance of 0.7%. The S&P Midcap 400 Index ($MID) also climbed 0.7%, while the small-cap Russell 2000 Index ($IWM) broke out above major technical resistance and jumped 1.2%. The gains of the S&P 500 Index ($SPX) and Dow Jones Industrial Average ($DJIA) were more muted, at 0.4% and 0.3% respectively. Total volume in the NYSE eased 3%, but turnover in the Nasdaq was 3% greater than the previous day’s level. As such, the Nasdaq registered a bullish “accumulation day,” which matched the higher volume gain the NYSE printed earlier this week.
In order to identify the best ETFs to buy now, it’s important to determine which ETFs showed the most relative strength to the broad market during the recent decline. ETFs that made lower lows and lower highs in recent months, alongside of the main stock market indexes, are probably not the best ETFs to trade right now because there is no bullish divergence. Rather, we have been screening for ETFs that held up near their highs, even while the Nasdaq was getting hammered.
So, which ETFs exhibited the most relative strength after the major indices started selling off in September? With the exception of S&P Homebuilders SPDR ($XHB), just about all the ETFs that showed relative strength were international ETFs, which have a lesser correlation to the direction of the US stock market. One such ETF that has been holding up well, and is now setting up for a possible swing trading buy entry is iShares Poland Index ($EPOL). As you can see on the chart below, $EPOL is poised to break out above resistance to a fresh 52-week high:

As you will see in the ETF Watchlist of today’s newsletter, $EPOL has been added as an “official” swing trade setup. Our buy entry is just above yesterday’s high, which corresponds to a breakout above the horizontal price resistance. Our protective stop price is below convergence of the 20 and 50-day moving averages, which should serve as substantial support in the event of a pullback. This correlates to the stop being below the intraday low of the November 28 bullish reversal bar as well. Since this ETF is poised to breakout to a new high, there is no target at this time, though we generally are looking for at least a 2 to 1 reward-risk ratio if it breaks out and follows through to the upside.
In addition to $EPOL, there are several other international ETFs that have held up well during the recent correction. One such ETF was iShares China Xinhua 25 Index ($FXI), of which we bought a small “starter position” yesterday. A few other international ETFs with relative strength on our radar screen include: Hong Kong ($EWH), Turkey ($TUR), and Philippines ($EPHE). Of these, $EPHE has been so strong that it broke out to a fresh all-time high just one day after the November 16 lows were formed in the US markets. Now, it is on our radar screen as a potential buy entry if it pulls back to near new support of its recent breakout (remember that a prior level of resistance becomes the new support, after the resistance is broken):

In addition to buying FXI yesterday, our position in ProShares Short Russell 2000 ($RWM) hit its stop when the Russell 2000 Index gapped up above major resistance of its multi-month downtrend line, as well as the high of its November 28 bearish reversal candle. But that’s okay. The setup at time of entry was solid, and our stop was in the right place. It was simply a trade that didn’t work out…wasn’t the first and definitely won’t be the last. Whenever we have trades that turn out to be losers, we always ask ourselves the following question: “Given what I know now, would I still have entered the trade when I did?” If the answer to that question is “yes,” then there is never a reason to feel bad about a losing trade because it means the trade setup was solid and we simply followed our trading plan.
We’ve been scanning extensively for bullish ETF swing trading setups over the past few days, but most of better looking chart patterns presently belong to individual stocks, rather than ETFs. This is normal, as new leadership in markets reversing off their lows usually begins with breakouts in strong stocks, then subsequently filters down to ETFs (which are usually indexes of stocks). However, in sideways to down markets, ETF trading opportunities are usually much better than with individual stocks; hence the reason The Wagner Daily newsletter trades both ETFs and individual stocks in its model portfolios, the balance of which is dependent on the current mode of our market timing model. This enables us to have the “best of both worlds” by having low-risk, profitable trading opportunities regardless of market conditions.
stock commentary:
$ALJ, $QIHU, and $URI joined $PRXL in the stock portfolio. We like the mix of open positions and will look to add one or two more positions at reduced size.
The $NTE buy limit order remains open. Please note that if the buy limit is hit and you are not triggered PLEASE BUY IMMEDIATELY at the market. The goal isn’t to get our trigger price exactly, but around there if the action does pull back.
$ALKS is a new buy setup for Friday. Although it’s relative strength ranking is a little lower than we like at 82 (our min. relative strength is 80), we really like the tight consolidation on the weekly chart.

On the daily chart, $ALKS has tightened up nicely and is a buy above the 11/28 reversal candle high.

As mentioned yesterday, our goal is to own 4-6 positions which should bring our total long exposure up to the 30-50% range. If most of these setups work out and we book some gains, then we can add new positions and increase our share size. If these setups fail, then we will back away from the market and reassess. Once the positions are in, our job is to simply monitor the feedback.
If you are a new subscriber, please e-mail [email protected] with any questions regarding our trading strategy, money management, or how to make the most out of this report.
relative strength combo watchlist:
Our Relative Strength Combo Watchlist makes it easy for subscribers to import data into their own scanning software, such as Tradestation, Interactive Brokers, and TC2000. This list is comprised of the strongest stocks (technically and fundamentally) in the market over the past six to 12 months. The scan is updated every Sunday, and this week’s RS Combo Watchlist can be downloaded by logging in to the Members Area of our web site.