Buy Mode
– Timing model generated buy signal on close of March 5 (click here for more details)
today’s watchlist (potential trade entries):

Having trouble seeing the open positions graphic above? Click here to view it directly on your web browser instead.
open positions:
Below is an overview of all open positions, as well as a report on all positions that were closed only since the previous day’s newsletter. Net P/L figures are based on two separate $50,000 model portfolios (one for ETFs and one for stocks). Changes to open positions since the previous report are listed in pink shaded cells below. Be sure to read the Wagner Daily subscriber guide for important, automatic rules on trade entries and exits.

Having trouble seeing the open positions graphic above? Click here to view it directly on your web browser instead.
closed positions:
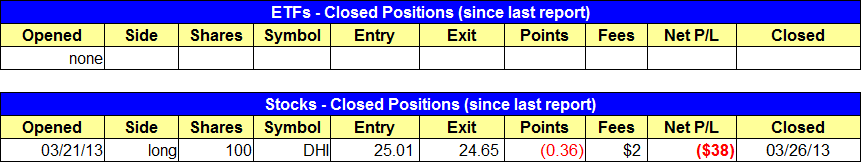
Having trouble seeing the closed positions graphic above? Click here to view it directly on your web browser instead.
ETF position notes:
- No trades were made.
stock position notes:
- Sold $DHI on the open for a small loss.
ETF, stock, and broad market commentary:
Stocks responded favorably to Monday’s distribution in the S&P 500 with a solid day of gains across the board. However, the price action was not confirmed by volume, which has been a problem since the market bottomed out after a sharp pullback in late February. Despite the weak volume, major sectors and leading industry groups continue to act healthy.
Although the market continues to advance on light volume, it’s tough to ignore the fact that many charts and leadership stocks still look good. Yes, we have had a few leaders break down like $DDD or $OCN, but the majority of leadership stocks are holding above the 50-day MA and still trending higher or forming bullish basing patterns.
As we have mentioned in prior reports, price action is always king, so until market leadership clearly breaks down our bias must be on the long side. With that in mind, we have a several new buy setups on today’s watchlist.
One new ETF setup is in the First Trust DJ Internet Index Fund ($FDN), which broke out from a year and a half long consolidation in January. After stalling out around 44.00, $FDN has formed a flat base with a shallow correction and gentle pullback to the rising 10-week MA. This is the type of basing action we like to see after a breakout from a long base.

Dropping down to the daily chart, we see that $FDN failed a breakout attempt in early March and sold off sharply before finding support at the 50-day MA. Since then it has formed a tight range at the 50-MA while setting a higher low within the base, which is bullish.

The plan is to establish partial size in $FDN on a breakout above the tight, six-day range and look to add more size on a base breakout. We could potentially also add to the position before the breakout if $FDN prints another swing low prior to breaking out.
Other ETF watchlist setups include adding to an existing position in $XOP and buying a potential continuation breakout in $KBE.
On the stock side we have two new buy candidates along with $NTE and a re-entry in $SWFT.
After a nasty shakeout from a false breakout in mid-February, $MX (which IPO’d in March 2011) has tightened up nicely above the 50-day MA. Its relative strength ranking is very strong at 92 along with an equally strong EPS ranking of 94. The earnings and revenues have ramped up over the past three quarters and the ROE is at an impressive 35%. There is also a strong increase in funds the past 7 quarters, signaling that institutions want a piece. MX’s group rank is 20 out of 197 (stocks in the top 40 groups are ideal buy candidates). The buy entry is over the 3/20 high with a pretty tight stop.

Navigating the market over the past few weeks has been tough due to the mixed signals in our timing model. However, price action is king and for the moment the market is holding up with new setups emerging, and that is a bullish sign.
Note: The US stock market will be closed on Friday, March 29, so we will not publish a report on Thursday night (for Friday). Normal publication will resume on Sunday night for Monday, April 1. Have a Happy Holiday Weekend!
relative strength combo watchlist:
Our Relative Strength Combo Watchlist makes it easy for subscribers to import data into their own scanning software, such as Tradestation, Interactive Brokers, and TC2000. This list is comprised of the strongest stocks (technically and fundamentally) in the market over the past six to 12 months. The scan is updated every Sunday, and this week’s RS Combo Watchlist can be downloaded by logging in to the Members Area of our web site.