market timing model: (Confirmed) Buy
Current signal generated on close of September 9.We are now in confirmed buy mode, so portfolio exposure can be more than 100% if you have a marginable account. However, please make sure that current long positions in your portfolio are working before adding new ones. Portfolio exposure should be at least 75% to 100% (or more) right now.
Past signals:
- Neutral signal generated on close of August 15
- Buy signal generated on close of July 11
- Neutral signal generated on close of July 5
- Sell signal generated on close of June 24
today’s watchlist (potential trade entries):

Having trouble seeing the open positions graphic above? Click here to view it directly on your web browser instead.
open positions:
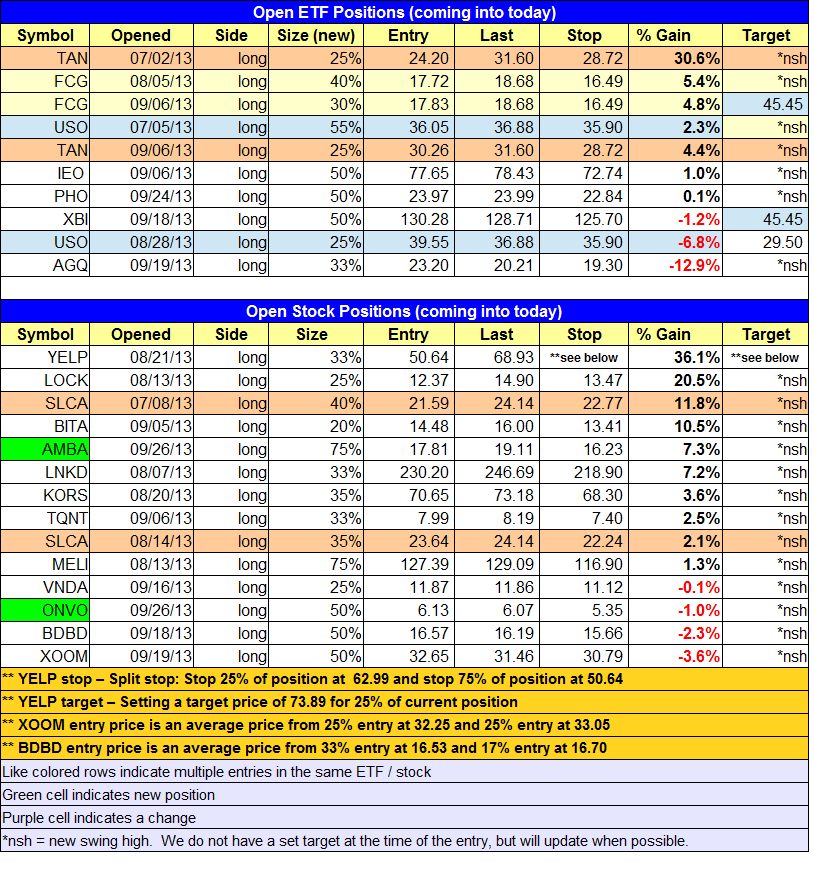
Below is an overview of all open positions, as well as a report on all positions that were closed only since the previous day’s newsletter. Changes to open positions since the previous report are listed in pink shaded cells below. Be sure to read the Wagner Daily subscriber guide for important, automatic rules on trade entries and exits. Click here to learn the best way to calculate your share size.
Having trouble seeing the open positions graphic above? Click here to view it directly on your web browser instead.
closed positions:

Having trouble seeing the closed positions graphic above? Click here to view it directly on your web browser instead.
ETF position notes:
- No trades were made.
stock position notes:
- $AMBA and $ONVO buy entries triggered.
ETF, stock, and broad market commentary:
We continue to see relative strength in the NASDAQ Composite and Russell 2000, with both averages printing inside days on Wednesday, while the S&P 500 and Dow Jones once again set a lower low. An inside day occurs when the total range (high to low) of price is within the previous day’s range. Within a consolidation pattern, it is a sign of the price action tightening up, which is bullish.
Yesterday’s retreat in the S&P 500 was on light volume, so it once again avoided distribution. With the S&P 500 struggling to find traction, a touch of the 50-day MA is a possibility later this week or early next week. The Dow is already at the 50-day MA.
We return to the chart of iShares MSCI Japan ($EWJ) tonight, because we are placing $EWJ on our watchlist as an official buy setup (trade details can be found above). After breaking the downtrend line of the consolidation, the price action is now sitting on top of all the major averages, just below resistance of the July mid-point at $12.20. The moving averages are finally in order, with the 20-day EMA (in beige) now trending higher for the past few weeks and above the 50-day MA (blue). The 50-day MA is also sloping slightly higher, and the 200-day MA (orange) remains in a clear uptrend.
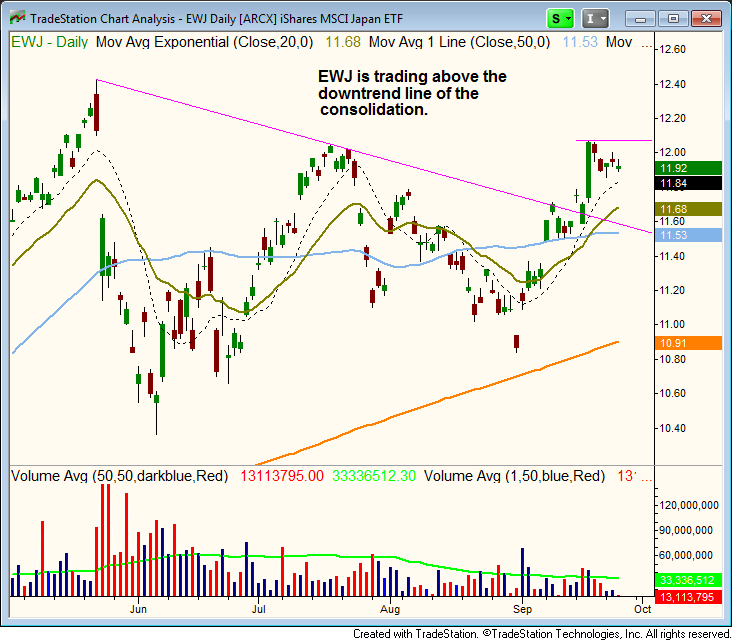
We are looking for a slight pullback to the rising 10-day MA as a buy entry. Note that we are placing a buy limit order, which means we are buying on weakness.
We continue to see strength in ETFs and stocks, with solid participation among many sectors. Maybe the financials and homebuilders have slowed down a bit, but there is certainly enough leadership left to push the market higher for a few months.
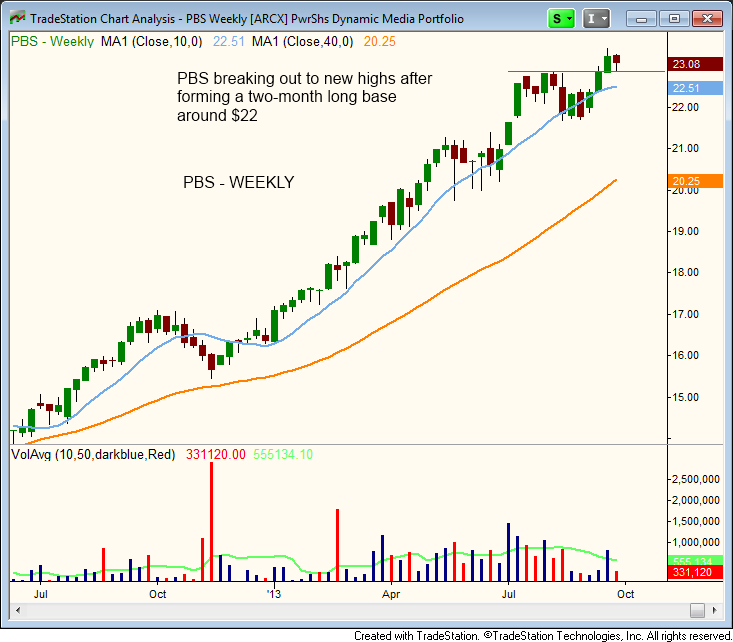
One such ETF showing strength is PowerShares Dynamic Media ($PBS), which has recently broken out from a tight-ranged consolidation at the highs. Volume picked up on the breakout to new highs last week, which is a bullish sign. We are not buying this ETF, we are simply pointing out strength.
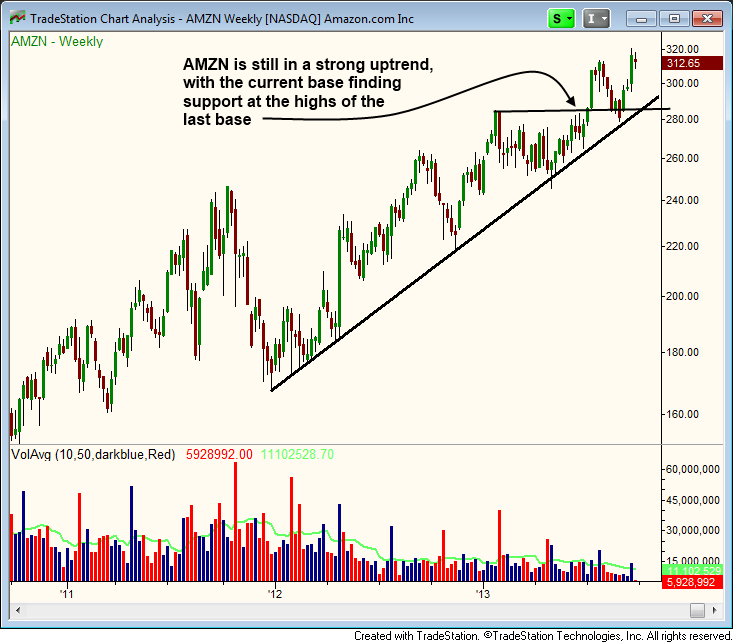
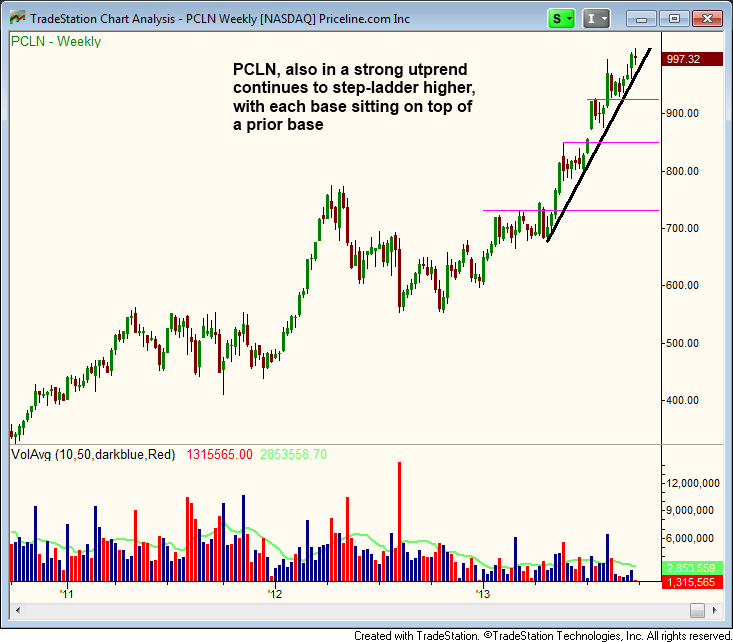
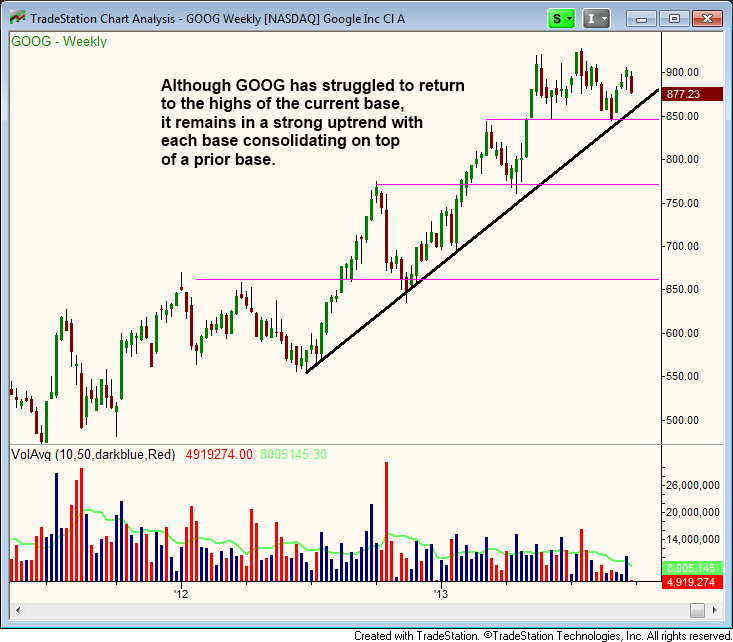
We continue to see big cap NASDAQ stocks act well for the most part. The following weekly charts of $AMZN, $PCLN, and $GOOG all have strong uptrends in place, with current basing action holding above the highs of the last base. If these institutional quality stocks and other leading stocks such as $LNKD, $QIHU, and $TSLA remain strong, then the market should be in good shape.
On the stock side, we bought $AMBA and $ONVO on Tuesdsay’s open. $AMBA had a really strong day, running 10% higher on heavy volume. $ONVO still has great potential, and a move above $6.20 could spark the next wave up.
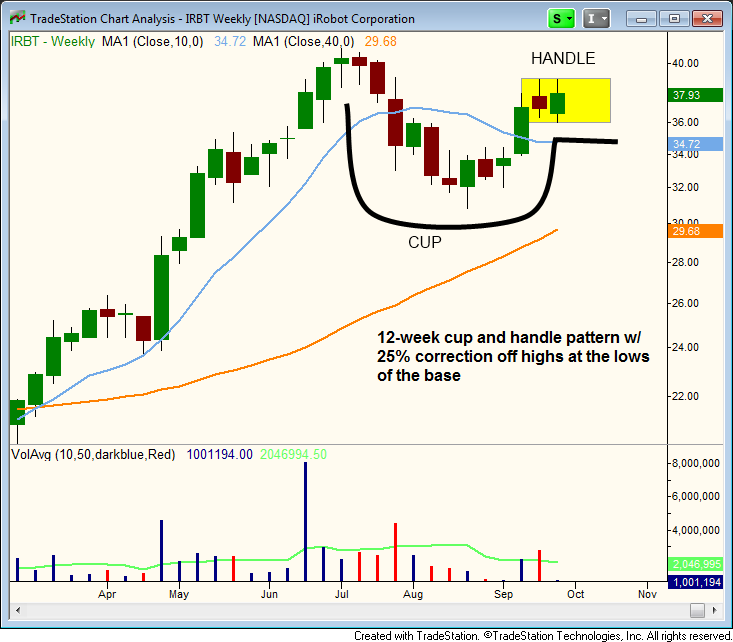
We do not have any new buy setups for tonight, but we are monitoring a few setups for entry points next week. $IRBT has great potential, and it is currently forming the cup portion of a cup and handle pattern. We look for the price to chop around for a week or two while holding support above $35, which could produce an ideal low-risk entry point. The weekly chart below details the cup and handle pattern:
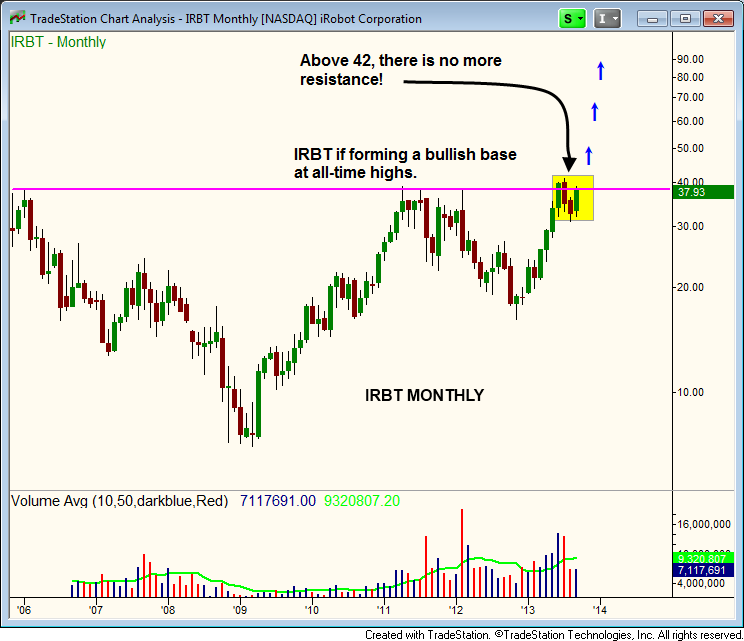
The best part about $IRBT is the monthly chart, which is currently consolidating near all-time highs. A breakout above $42 will have no resistance in its way, which could produce an explosive move as long as the market remains healthy.
<