Current signal generated on close of Feb. 13.
Portfolio exposure can be anywhere from 50% to 100% long (or more), depending on how open positions have held up.
Past signals:
- Sell signal generated on close of February 3.
- Neutral signal generated on close of January 24.
- Buy signal generated on close of November 13
- Buy signal generated on close of September 9
- Neutral signal generated on close of August 15
- Buy signal generated on close of July 11
- Neutral signal generated on close of July 5
- Sell signal generated on close of June 24
today’s watchlist (potential trade entries):

Having trouble seeing the open positions graphic above? Click here to view it directly on your web browser instead.
Below is an overview of all open positions, as well as a report on all positions that were closed only since the previous day’s newsletter. Changes to open positions since the previous report are listed in pink shaded cells below. Be sure to read the Wagner Daily subscriber guide for important, automatic rules on trade entries and exits.

Having trouble seeing the open positions graphic above? Click here to view it directly on your web browser instead.
closed positions:
Having trouble seeing the closed positions graphic above? Click here to view it directly on your web browser instead.
ETF position notes:
- Note that only one GLDX entry can trigger (the first setup to trigger cancels the other setup). Both $LIT entries can trigger since they are two buy stops.
stock position notes:
- $CTIC buy entry triggered. Note the new stops above.
ETF, stock, and broad market commentary:
Stocks sold off across the board on Tuesday, led by a -1.1% loss in the small cap Russell 2000. All other major averages closed in the -0.4% to -0.7% range. Volume picked up substantially on the session, producing distribution days in the S&P 500 and Nasdaq Composite.
In the last three sessions, the Nasdaq Composite has suffered two distribution days, and the count now stands at four distribution days over the past few weeks. Depending on how one counts two days of churning, there could be as many as six distribution days on board, which is more than enough to stop a rally.
However, the market has survived heavy distribution counts a few times over the past 20 months, but each time there was enough money rotating out of extended names and into new groups to keep the rally alive. As of right now, commodities are the place to be, led by a monster charge in Coffee ETF ($JO) and DB Agriculture ETF ($DBA). Gold mining stocks have also ripped off the highs ($GDXJ or $GLDX) and could be ready to run higher soon.
We should have more clues regarding the health of the current rally over the next two weeks, as we we see how leading stocks and groups react to the distribution in the Nasdaq.
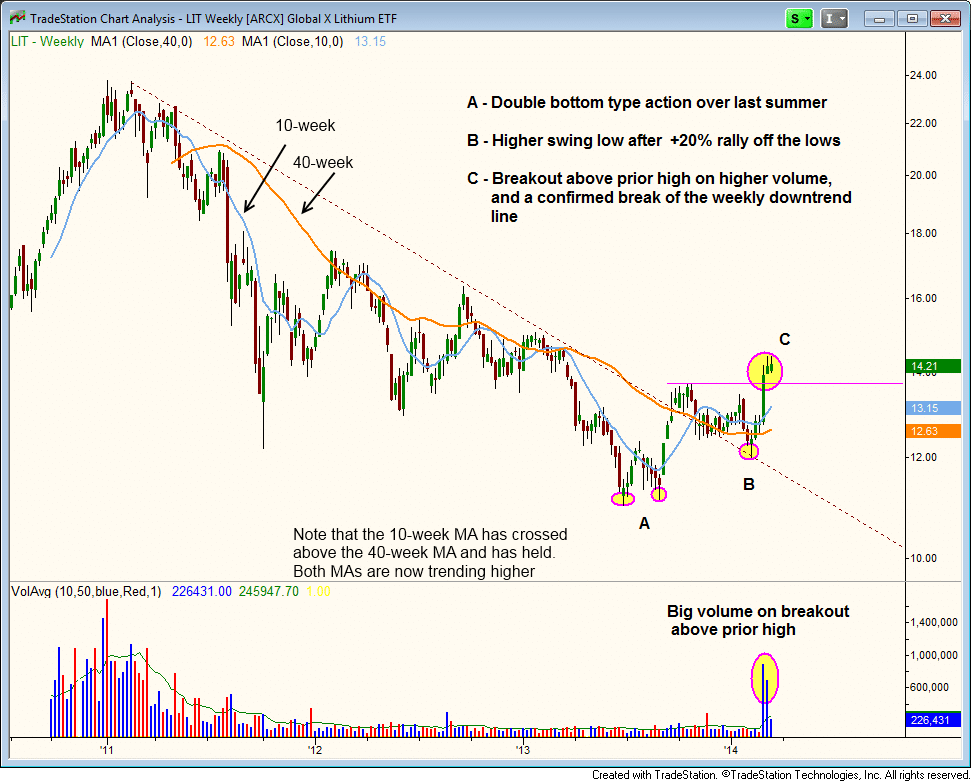
In sticking with the commodity theme, Global X Lithium ETF ($LIT) recently broke out above a major swing high on big volume.
The weekly chart below shows the bullish action in $LIT since last summer, where it formed a double bottom like pattern and attacked the weekly downtrend line. With support holding at $12, $LIT produced a higher swing low and recently broke out above the prior swing high. The breakout confirmed a reversal of trend.
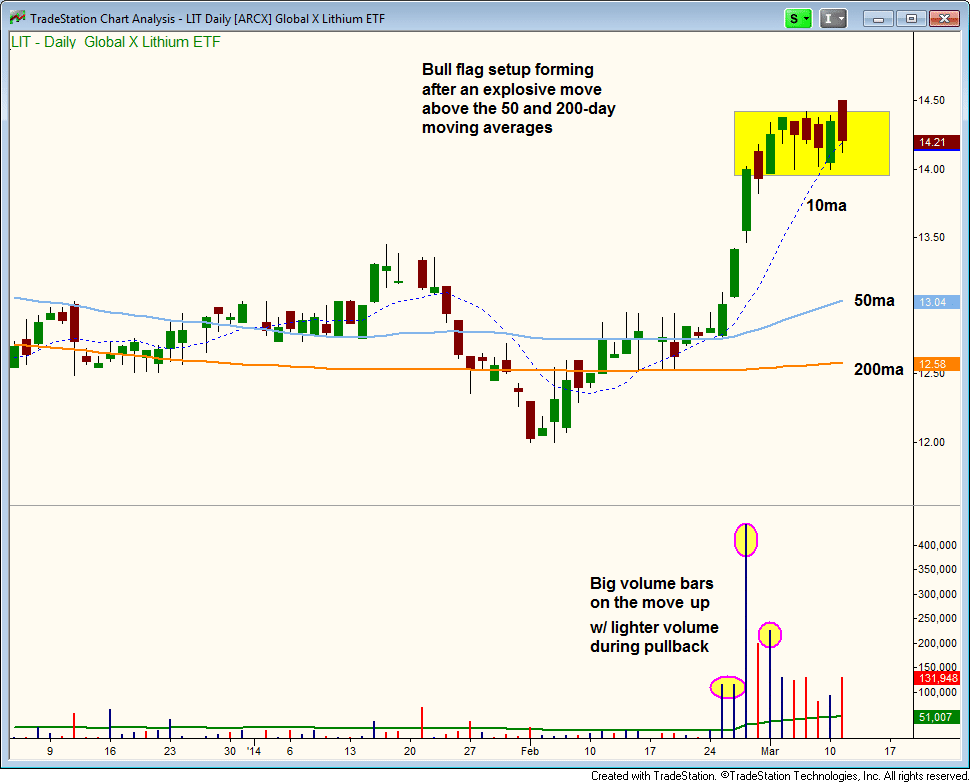
On the daily chart, we see the bull flag pattern that was created by an explosive price and volume move above the 50 and 200-day MAs. Since then, the price action has traded in a tight range, waiting for the 10-day MA to catch up.
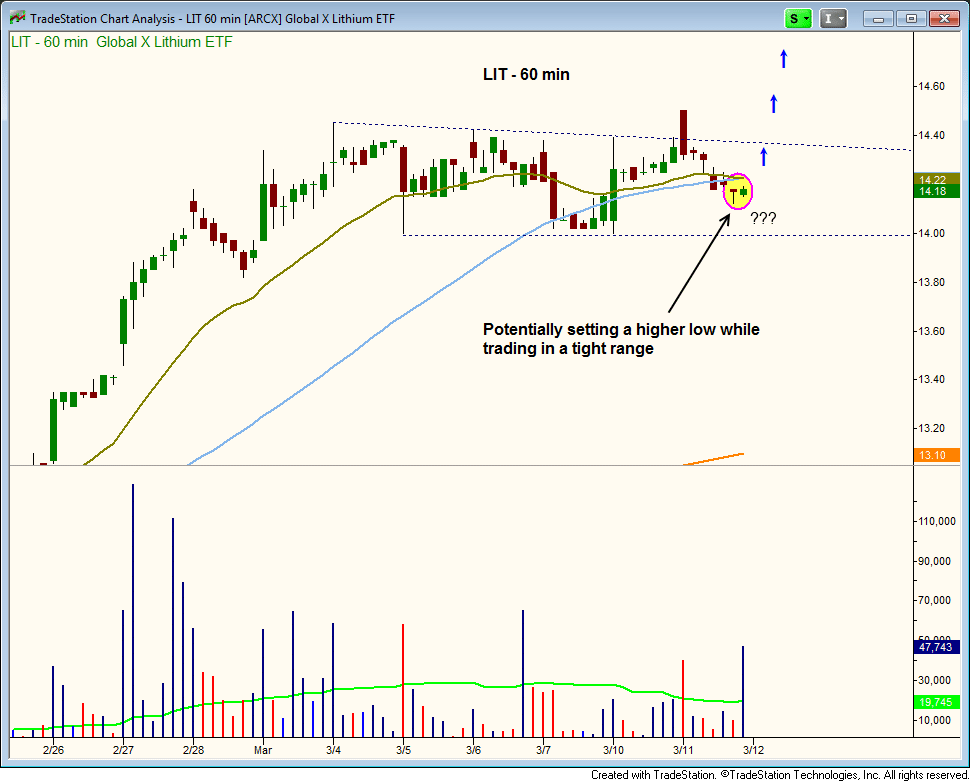
The hourly chart shows the tight price action of the past few days. If yesterday’s undercut of the 20-day EMA holds, then $LIT will have a higher low in place on the hourly chart. It is usually the sign of a very strong uptrend, whhen a stock or ETF rips higher and finds support at or around the 20-period EMA on its first pullback. We are placing $LIT on today’s watchlist. Trade details can be found above.
On the stock side, we are not thrilled about the price action $AWAY, so we decided to put a bullet in the position with a very tight stop. Since our entry was much higher, we are not playing with a strong hand. So when this happens, its best to get out of the way and wait for a better entry point.
We also raised the stop in $CTIC due to the false breakout and ugly close. However, $CTIC can still recover from yesterday’s action if it holds above Tuesday’s low.
We still like the $TSLA buy limit setup and believe that it has the potential to push higher even if the market tops out over the next few weeks.