market timing model:
SELL – Signal generated on the close of July 10 (click here for more details)
today’s watchlist (potential trade entries):

open positions:
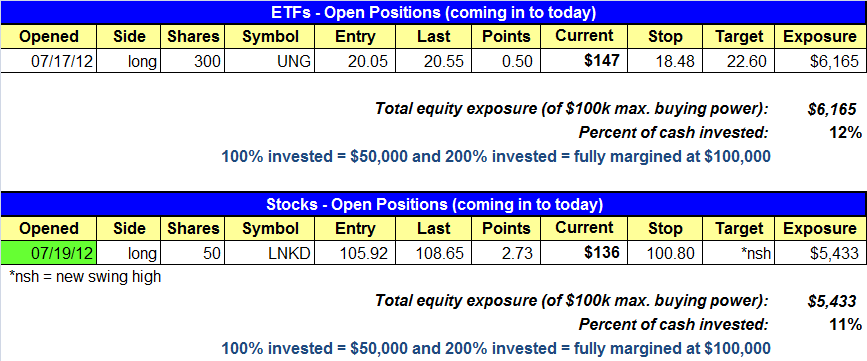
Below is an overview of all open positions, as well as a report on all positions that were closed only since the previous day’s newsletter. Net P/L figures are based on two separate $50,000 model portfolios (one for ETFs and one for stocks). Changes to open positions since the previous report are listed in red shaded cells below. Be sure to read the Wagner Daily subscriber guide for important, automatic rules on trade entries and exits.

Having trouble seeing the open positions graphic above? Click here to view it directly on your web browser instead.
closed positions:

Having trouble seeing the closed positions graphic above? Click here to view it directly on your web browser instead.
ETF position notes:
- No trades were made.
stock position notes:
- LNKD triggerd a buy entry.
ETF and broad market commentary:
Stocks ended the session mostly higher on mixed trade. The Nasdaq showed relative strength for the second consecutive day as it posted a 0.8% gain. Both the Dow Jones Industrial Average and the S&P 500 tacked on 0.3%, while the S&P added a modest 0.1%. The small-cap Russell 2000 was the sole loser on the session, as it slid 0.4%.
Thursday ended with mixed internals. Despite its relative strength, turnover fell on the Nasdaq by 4.6%, while the NYSE saw an uptick in volume of just over 11.0%. Advancing volume topped declining volume on the Nasdaq by a ratio of 1.5 to 1 and on the NYSE by a ratio of 1.1 to 1.
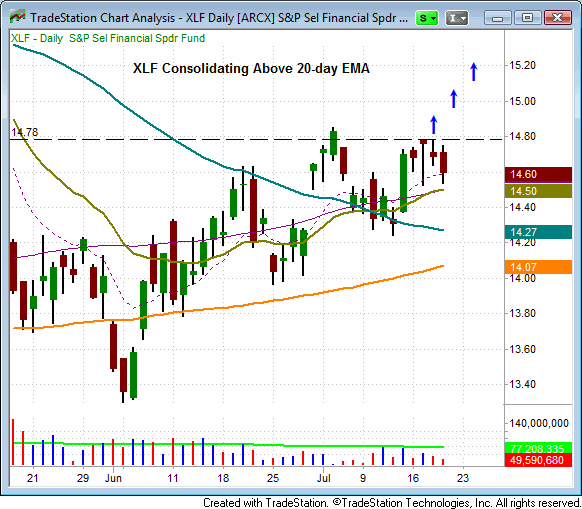
Following an undercut of its 50-day MA, on July 13th, the S&P Select Financial SPDR Fund (XLF) gapped up and reclaimed support of its 50-day and 20-day moving averages, on a burst of volume. Since that time, XLF has spent the last four sessions consolidating above support of its 20-day EMA. Further, on July 17th, XLF formed a reversal candle on another burst of volume (day-over-day). A move above the July 17th high of $14.78 could provide a buying opportunity in this ETF.

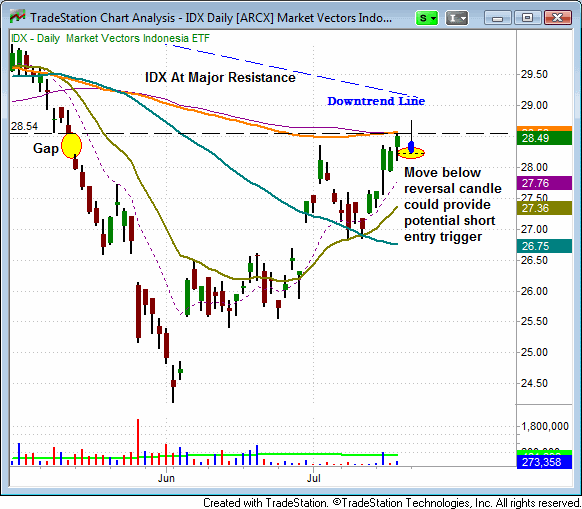
Since reversing off of its June 4th lows, the Market Vectors Indonesia ETF (IDX) has rallied into resistance of its 200-day MA and filled the gapped formed in May of this year. IDX could provide a shorting opportunity if it forms a reversal candle at the current level (See blue candlestick). Reversal candles demonstrate that the trend is weakening and provide a potential entry trigger. We will continue to monitor IDX as a possible short candidate.

UNG continued its advance yesterday, but volume was light. Early in the session, it appeared as if this ETF might break through resistance of the July 6th swing high ($20.62). However, sellers stepped in throughout the day whenever UNG attempted to breach this key level. UNG will likely need to see a burst of Volume to move above this key resistance point. In the broad market, Thursday’s price and volume action was uneventful but predictable, in the wake of a five day run up. Further, the Nasdaq, S&P 500 and DJIA are at or near resistance of their July 5th swing highs. We wouldn’t be surprised to see a few days of consolidation or a pullback off the current levels, prior to any potential move higher.
stock commentary:
We are working on adding a nuetral mode for the market timing model which currently operates in four modes: buy, confirmed buy, sell, and confirmed sell. With the addition of a nuetral phase, we can avoid the confusion created whenever we buy stocks on a sell signal. The nuetral mode will basically take the place of a sell signal whenever a buy signal fails during the bottoming out process. For example, when the market is topping out, we go from confirmed buy mode to sell mode. When the market is attempting to bottom out (like it is now) and a new buy signal fails within a few days we shift to nuetral. That should clear up our thought process a bit more especially for those who are new to the service.
LNKD triggered its long entry on a slight pick up in volume. The volume should pick up if/when it breaks the 110.00 level to signal there is strond demand for the stock. Remember earnings season is heating up, so please make sure to check earnings before taking on new trade.sd
If you are a new subscriber, please e-mail [email protected] with any questions regarding our trading strategy, money management, or how to make the most out of this report.
relative strength watchlist:
Our Relative Strength (or RS) Watchlist makes it easy for subscribers to import data into their own scanning software, such as Tradestation, Interactive Brokers, and TC2000. This list is comprised of the strongest 100 (or so) stocks in the market over the past six to 12 months. The scan is updated every Sunday, and this week’s RS Watchlist can be downloaded by logging in to the Members Area of our web site.