Sell
– Signal generated on the close of April 18 (click here for more details)
today’s watchlist (potential trade entries):

Having trouble seeing the open positions graphic above? Click here to view it directly on your web browser instead.
open positions:
Below is an overview of all open positions, as well as a report on all positions that were closed only since the previous day’s newsletter. Net P/L figures are based a $100,000 model portfolio. Changes to open positions since the previous report are listed in pink shaded cells below. Be sure to read the Wagner Daily subscriber guide for important, automatic rules on trade entries and exits.
 Having trouble seeing the open positions graphic above? Click here to view it directly on your web browser instead.
closed positions:

Having trouble seeing the closed positions graphic above? Click here to view it directly on your web browser instead.
ETF position notes:
- $EIDO buy setup triggered.
stock position notes:
- No trades were made.
ETF, stock, and broad market commentary:
Led by solid gains in the Nasdaq 100 and Nasdaq Composite, stocks closed higher across the board. The Nasdaq complex easily outperformed the S&P 500 on Monday, signaling that money is beginning to rotate out of the S&P 500 (and Dow) and in to the Nasdaq.
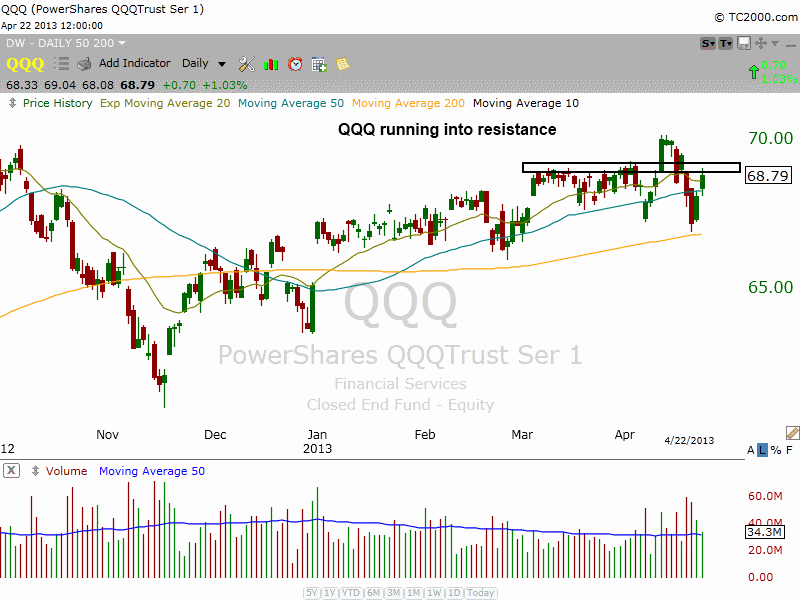
Over the past two sessions, the Nasdaq has climbed about 2.5% off last Thursday’s low; however, volume has declined the past two sessions, failing to confirm the move. The Nasdaq may need a bit more time to consolidate, as there is quite a bit of overhead resistance. Looking at the daily chart of the Nasdaq 100 ETF ($QQQ) below, we see price action running in to resistance clustered around 69.00.

The five weeks of stalling action at $69, along with the 10 and 20-day MAs make for quite a bit of resistance. If $QQQ can power through this level without further consolidation it would be a very bullish sign.
$EIDO was added to the portfolio as it triggered a buy entry yesterday, breaking out above range highs on higher than average volume. $UNG pulled back on Monday, but should find support at or around the rising 10-day moving average over the next few days.
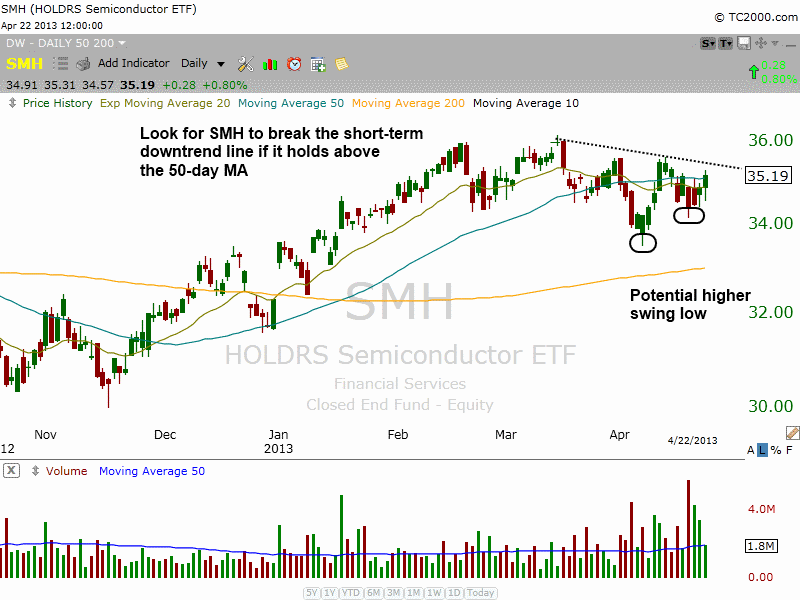
Market Vectors Semiconductor ETF $(SMH) continues to chop around its 50-day MA, with support clearing coming in around 34.50 last week. If $SMH can set a higher swing low and close above Monday’s high on a pick up in volume, then it may attract enough buying interest to break the short-term downtrend line and test the highs of the base.

$SMH is on today’s official watchlist, as we look to add to our position on strength (see details in the watchlist section above).
On the stock side, we see plenty of new buy setups emerging, but many of these setups report earnings within the next 10 days (such as $ANGI, $NOW, $ARMH, $PRLB).
$AMBA remains a top notch setup that we are monitoring for a low risk entry point (earnings are not until August,which is a big plus). $WDAY, $TRLA, $BLOX, and $P are also on the list.
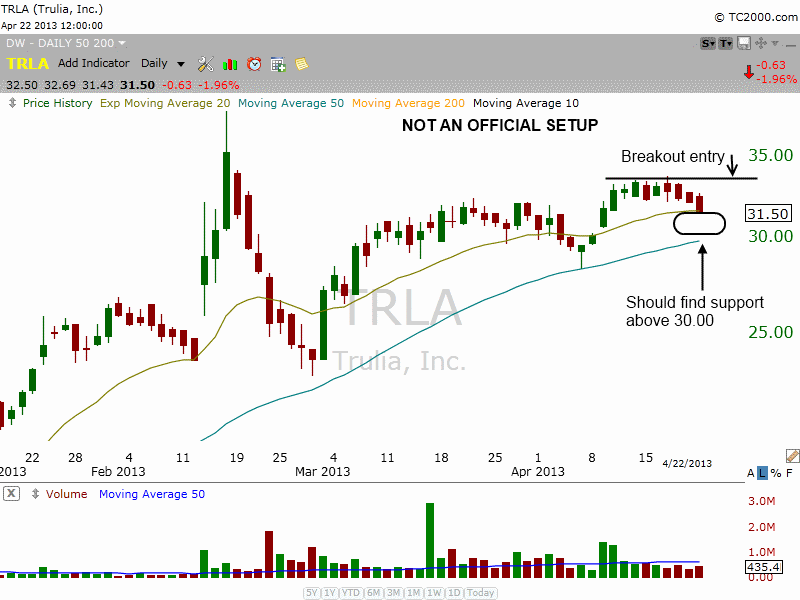
$TRLA is forming a tight handle after bouncing off support of the 50-day MA in early April on decent volume. The price aciton should hold above $30 on any pullback.

If $TRLA can form some sort of reversal bar in between the 20 and 50-day MAs this week, then we might be able to grab a low risk entry with a fairly tight stop. This entry would be for partial size, and we would look to add the rest of the position on a breakout above 33.76. Note how volume has remained below average during the consolidation, which is a bullish sign.
The market’s light volume rally the past two days is a warning sign, indicating that the averages may need a bit more time to consolidate. We are slowly adding exposure at logical entry points, but we want to be careful not to add too much long exposure until volume confims.
relative strength combo watchlist:
Our Relative Strength Combo Watchlist makes it easy for subscribers to import data into their own scanning software, such as Tradestation, Interactive Brokers, and TC2000. This list is comprised of the strongest stocks (technically and fundamentally) in the market over the past six to 12 months. The scan is updated every Sunday, and this week’s RS Combo Watchlist can be downloaded by logging in to the Members Area of our web site.