sell
today’s watchlist (potential trade entries):

open positions:
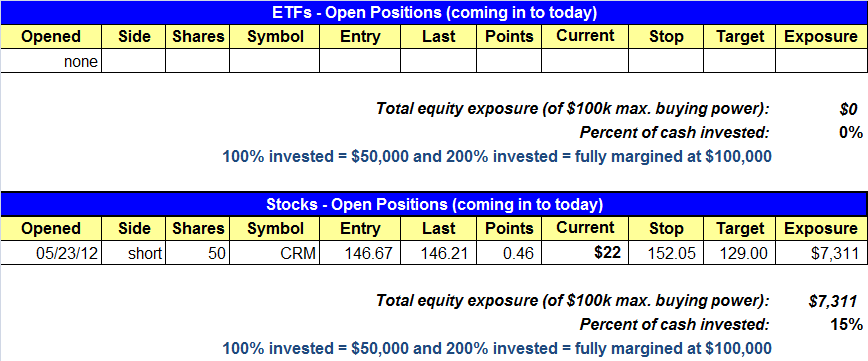
Below is an overview of all open positions, as well as a report on all positions that were closed only since the previous day’s newsletter. Net P/L figures are based on two separate $50,000 model portfolios (one for ETFs and one for stocks). Changes to open positions since the previous report are listed in red shaded cells below. Be sure to read the Wagner Daily subscriber guide for important, automatic rules on trade entries and exits.

Having trouble seeing the open positions graphic above? Click here to view it directly on your web browser instead.
closed positions:

Having trouble seeing the closed positions graphic above? Click here to view it directly on your web browser instead.
ETF position notes:
- No trades were made.
stock position notes:
- No trades were made.
ETF and broad market commentary:
Stocks ended the session mixed but for a second day in a row, reversed to close near session highs. The Nasdaq showed relative weakness as it was the only one of the major indices to close lower. The tech-rich index fell 0.4% on the day. The S&P 500 eked out a 0.1% gain, while the small cap Russell 2000 added 0.2%. Both the S&P MidCap 400 and the Dow Jones Industrial Average tacked on 0.3%.
Market internals were also mixed on Thursday. Volume dropped on the Nasdaq by 9.8% and on the NYSE by 11.3%. However, advancing volume edged out declining volume on the NYSE by a factor of 1.3 to 1, while declining volume held the upper hand on the Nasdaq by the same factor of 1.3 to 1.
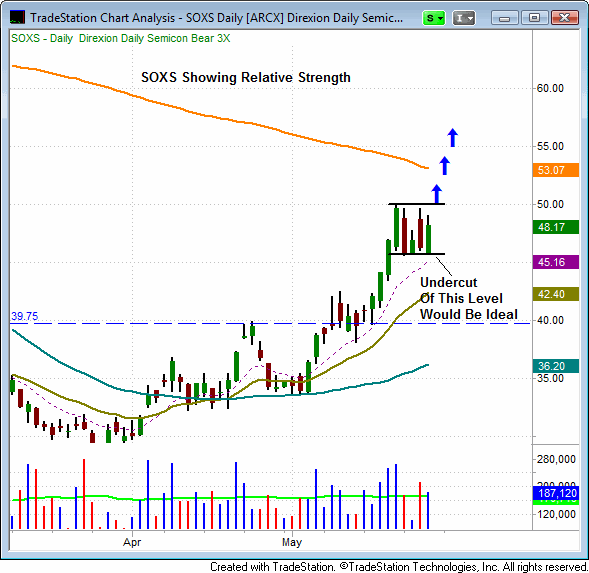
Over the past five sessions the Direxion Semiconductor 3x Bear ETF (SOXS) has held support above its 10-day MA while trading in a four dollar range. A volume fueled move above the five day high of $50.00 could present a buying opportunity in this inverse ETF. Ideally, we would like to see an undercut of the five day low prior to SOXS potentially moving higher. Undercuts serve to shake weak hands out of the trade while at the same time sweeping poorly placed stops.

Yesterday’s market action was a tug of war between bulls and bears, with market bulls eventually gaining the upper hand by day’s end. If the broad market can rally above the three day high, it appears as if we are headed for resistance of the 20-day EMA on each of the major indices. Still, the market has struggled significantly to gain its footing in its attempt to move higher. We don’t intend on taking on any new positions until we get a definitive signal from the market. A bounce into resistance of the 20-day EMA by each of the major indices would likely provide a better set of conditions in which to take on potential new short positions.
stock commentary:
We have only one short position in CRM, which did show some relative weakness yesterday but still needs to crack support at 145.00. Although V appears to be a decent short setup, the hourly chart of the S&P 500 is beginning to tighten up which could lead to a breakout above the three day high. Ideally we would like the market to bounce higher before establishing new short positions.
If you are a new subscriber, please e-mail [email protected] with any questions regarding our trading strategy, money management, or how to make the most out of this report.
relative strength watchlist:
Our Relative Strength (or RS) Watchlist makes it easy for subscribers to import data into their own scanning software, such as Tradestation, Interactive Brokers, and TC2000. This list is comprised of the strongest 100 (or so) stocks in the market over the past six to 12 months. The scan is updated every Sunday, and this week’s RS Watchlist can be downloaded by logging in to the Members Area of our web site.