market timing model:
BUY (click here for more details)
today’s watchlist (potential trade entries):

open positions:
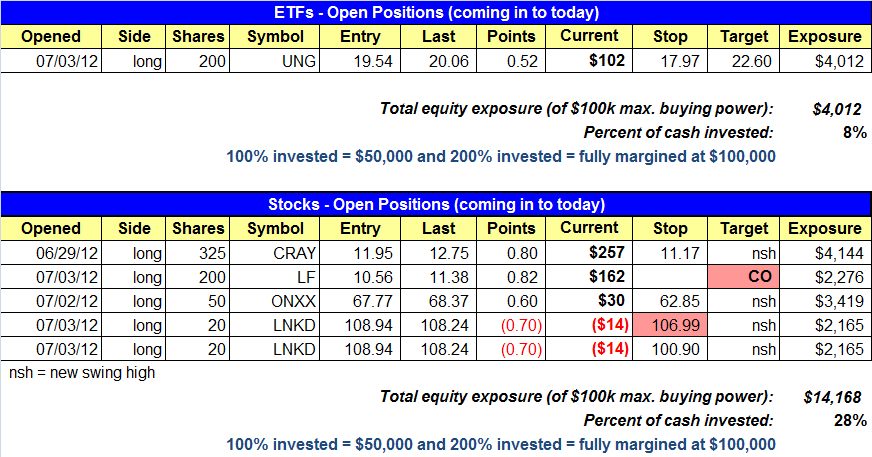
Below is an overview of all open positions, as well as a report on all positions that were closed only since the previous day’s newsletter. Net P/L figures are based on two separate $50,000 model portfolios (one for ETFs and one for stocks). Changes to open positions since the previous report are listed in red shaded cells below. Be sure to read the Wagner Daily subscriber guide for important, automatic rules on trade entries and exits.

Having trouble seeing the open positions graphic above? Click here to view it directly on your web browser instead.
closed positions:

Having trouble seeing the closed positions graphic above? Click here to view it directly on your web browser instead.
ETF position notes:
- No trades were made.
stock position notes:
- Note we are selling LF at market on the open.
- LNKD is listed twice due to the split stop.
ETF and broad market commentary:
Stock fought their way back from early losses yesterday, to end the session mixed. The S&P 500 was the day’s biggest loser, as it slid 0.5%. The Dow Jones Industrial Average fell 0.4%, while the small-cap Russell 2000 ended lower by 0.1%. The S&P MidCap 400 ended the day at break even and the Nasdaq managed to close fractionally higher.
Internals ended the day mixed. As would be expected following Tuesday’s shortened session, volume rose on the NYSE by 44.4% and on the Nasdaq by 30.0%. However declining volume outpaced advancing volume on both exchanges. The ratio of declining volume to advancing volume ended the day at a negative 2.3 to 1 on the NYSE and a negative 1.1 to 1 on the Nasdaq. Since yesterday’s volume was bound to be higher than Tuesday’s pre-Holliday volume, it would be inappropriate to classify yesterday as a distribution day. Only if volume had been above the fifty period moving average, would we have potentially considered yesterday to be a distribution day on the NYSE or the S&P 500.
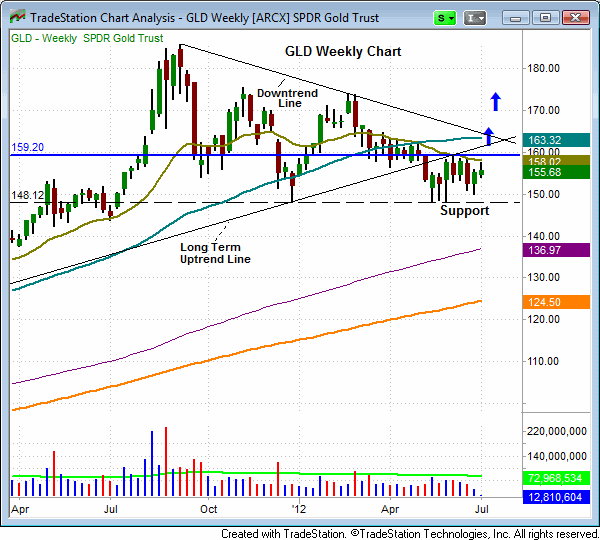
Since hitting an all time high last September, the SPDR Gold Trust ETF (GLD) has been in an intermediate downtrend. However, notice that on the weekly chart, GLD has formed numerous reversal candles, as it has established a support level near $148.00. If GLD can find its way back above $160.00, it will likely test resistance at its downtrend line. A break of the downtrend line could result in a significant move higher in GLD. Although this ETF has some work to do in order to reclaim its uptrend, it does appear to have found strong support at $148.00. Further, the significant number of reversal candles on the weekly chart suggests that GLD may soon make a move to resume the long term uptrend.

UNG rallied and closed marginally above its June 27th swing high yesterday. It could find resistance at this level but it continues to perform well. The broad market now faces key resistance at the two day high. Although we have seen buying into weakness will still anticipate a modest correction from the current levels.
stock commentary:
Yesterday, on a pick up in volume, LF broke out to new highs. This is usually a great sign; however, the high of day was nearly 13% above yesterday’s close and we have found that these big up days (up 10% or more) tend to lead to further consolidation rather than follow through when it is the first day of a breakout. With that in mind, we are selling LF at market on Friday’s open.
CRAY continues to act well so we are keeping the original stop in place. LNKD has failed to follow through from the breakout entry so we are raising the stop on half the position to bring our risk down a bit. The plan with ONXX is to raise the stop beneath the low of the first day that closes beneath the 10-day MA.
If you are a new subscriber, please e-mail [email protected] with any questions regarding our trading strategy, money management, or how to make the most out of this report.
relative strength watchlist:
Our Relative Strength (or RS) Watchlist makes it easy for subscribers to import data into their own scanning software, such as Tradestation, Interactive Brokers, and TC2000. This list is comprised of the strongest 100 (or so) stocks in the market over the past six to 12 months. The scan is updated every Sunday, and this week’s RS Watchlist can be downloaded by logging in to the Members Area of our web site.