Portfolio exposure can be anywhere from 50% to 100% long (or more), depending on how open positions have held up.
Past signals:
- Sell signal generated on close of February 3.
- Neutral signal generated on close of January 24.
- Buy signal generated on close of November 13
- Buy signal generated on close of September 9
- Neutral signal generated on close of August 15
- Buy signal generated on close of July 11
- Neutral signal generated on close of July 5
- Sell signal generated on close of June 24
(click here for more details)
today’s watchlist (potential trade entries):

Having trouble seeing the open positions graphic above? Click here to view it directly on your web browser instead.
open positions:Below is an overview of all open positions, as well as a report on all positions that were closed only since the previous day’s newsletter. Changes to open positions since the previous report are listed in pink shaded cells below. Be sure to read the Wagner Daily subscriber guide for important, automatic rules on trade entries and exits.

Having trouble seeing the open positions graphic above? Click here to view it directly on your web browser instead.
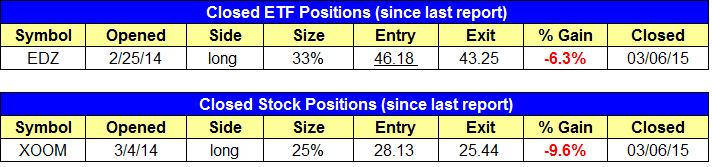
closed positions:
Having trouble seeing the closed positions graphic above? Click here to view it directly on your web browser instead.
ETF position notes:
- $UNG buy entry triggered to add to an existing position, and the $EDZ inverted short entry stopped us out.
stock position notes:
- $BONA buy entry triggered. $XOOM fell apart and stopped us out. Surprising action, but not every chart goes straight up when we buy, even in a good market.
ETF, stock, and broad market commentary:Stocks closed mixed on the session, with the S&P 500 and Dow Jones pushing slightly higher while the Nasdaq Composite was relatively weaker, as it broke down to new intraday lows in the afternoon.
Biotech stocks were hit hard for the second time in two-weeks yesterday, with $IBB selling off on higher than average volume. However, the $260 area appears to be support in $IBB, so next week’s price action will be important, as we’d like to see the action hold this level minus a shakeout bar or two.
With the market up nicely over the past few weeks, there simply isn’t a lot out there in terms of new setups on the ETF side. Unlike stocks, most ETFs move in step with the market except for a very few that are able to show relative strength or weakness.
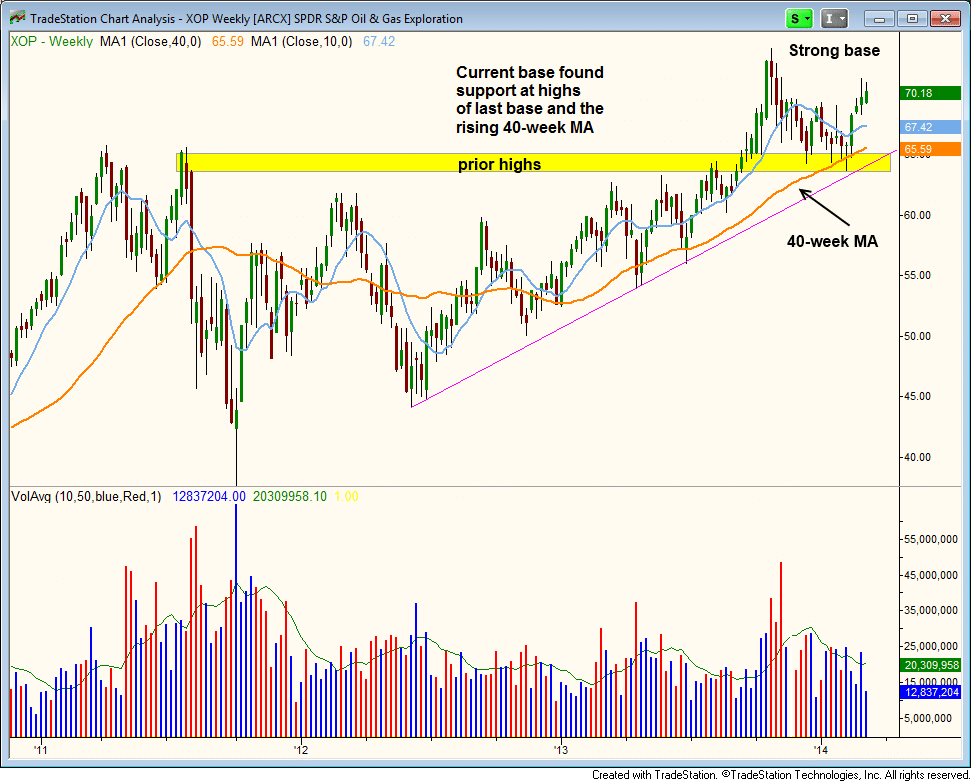
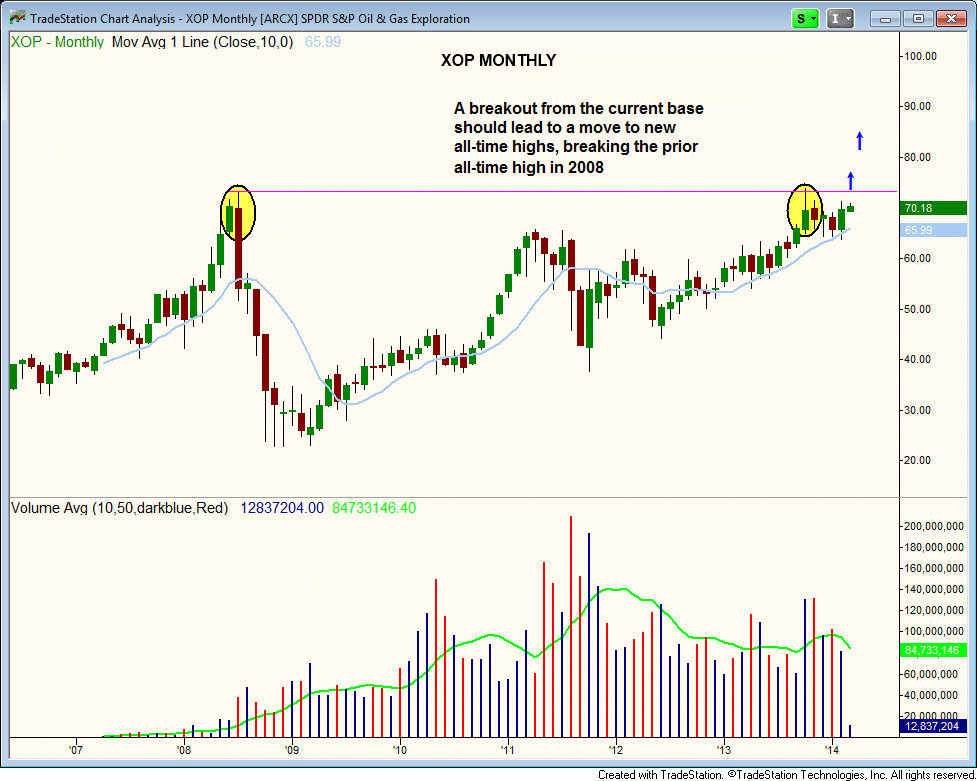
SPDR S&P Oil and Gas Exploration ($XOP) has formed a bullish cup and handle type pattern since pulling back off the highs of last October. The lows of the current base held above the highs of the last base, which is usually a logical area of support in a bull market. The price also found support at the rising 40-week MA, much like it did on both dips to this average in 2013.
 On the daily chart below, $XOP fooled many longs in late January with an undercut of the base lows and the 200-day MA before reversing. Since running off the lows, the 10-day MA and 20-day EMA have crossed above the 50-day MA. The 50-day MA is now sloping higher, joining the 20 and 200-day MAs, so there is quite a bit of positive momentum building.
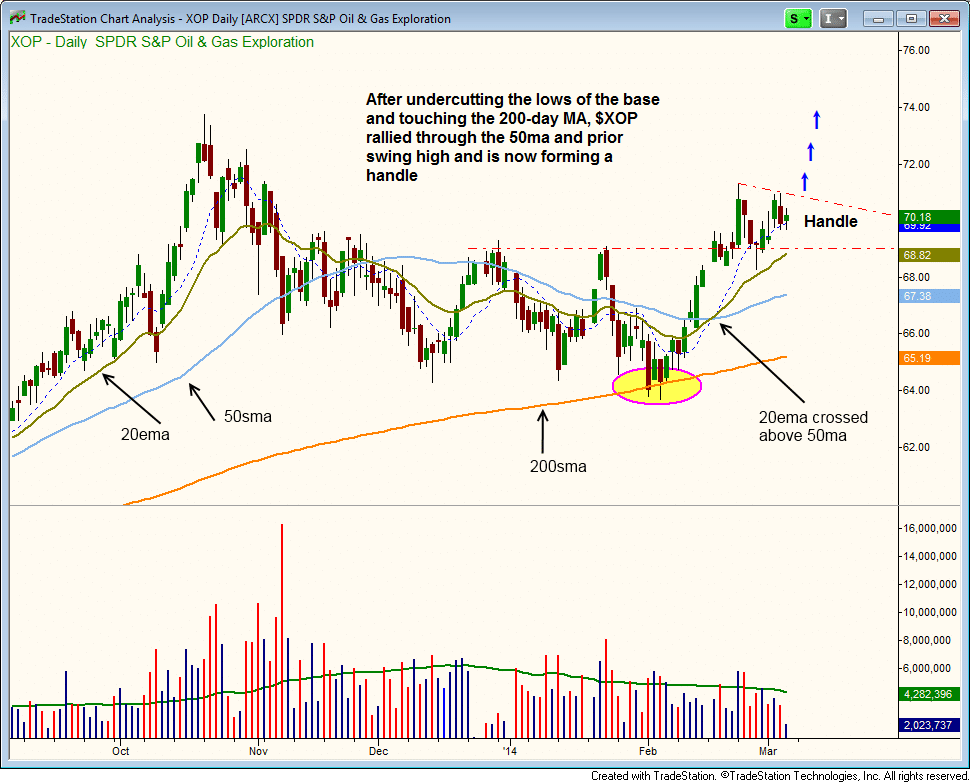 Currently, $XOP looks to be forming the handle portion of the cup and handle pattern (the cup is the action from last October to the recent swing highs two weeks ago). Handles can last from one to several weeks and should drift lower, or at the very least have one or two shakeout bars to scare off the weak longs.
The price action in the handle should hold above the 20-day EMA for the most part. We are placing $XOP on today’s watchlist. Trade details can be found above.
$XOP is a multiple time-frame breakout candidate, as a breakout above the current range high would send $XOP to new all-time highs, above the prior high of 2008.
 On the stock side, we added one new position in $BONA, which closed above the last swing high on decent volume. We look for a move to new highs to follow within the next two weeks. We canceled the $FOE buy limit order for now, but will look for an entry on weakness next week (unless better setups develop).
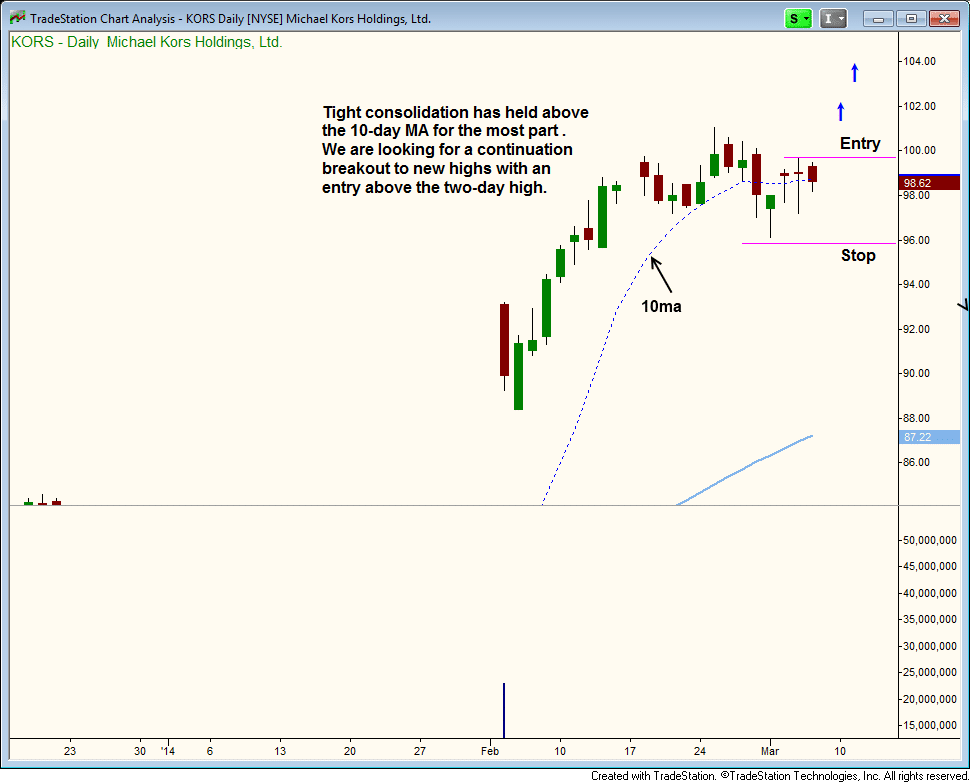
$KORS is back on our watchlist after several weeks of tight price action at new highs. The weekly chart below shows the tight closing action over the past three weeks, which is a bullish sign after a big volume breakout.
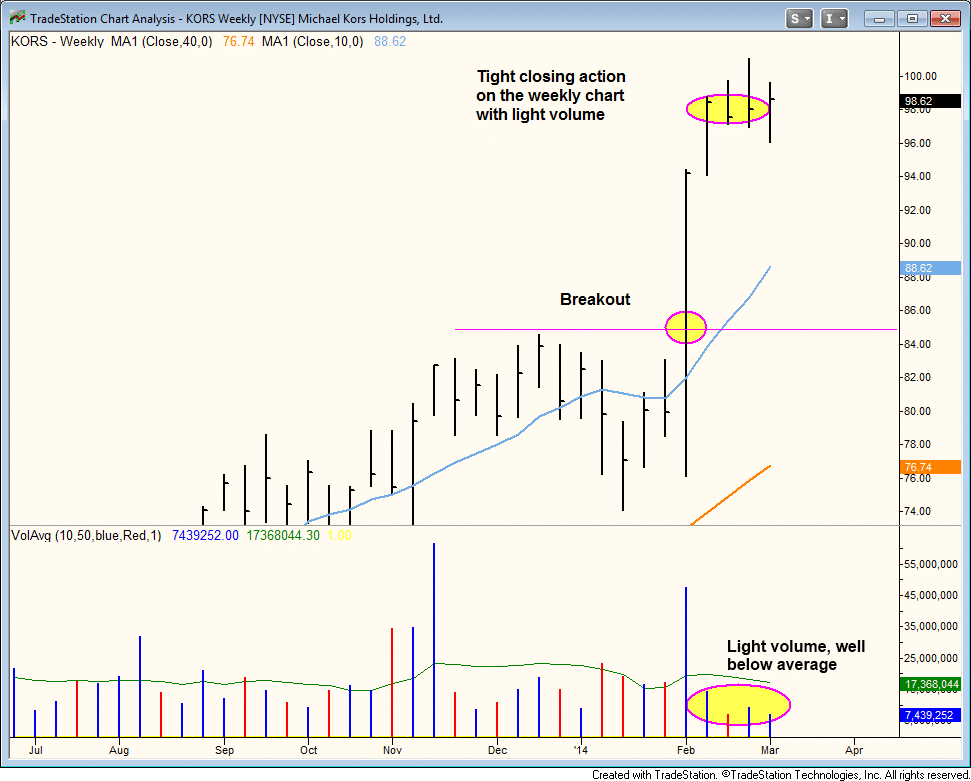 The daily chart of $KORS has formed a tight trading range the past three days right at the 10-day MA. A move above the two-day high looks to be a low risk entry point with a fairly tight stop just below the four day low. We may decide to cut the position sooner if it triggers and fails to move out right away.