market timing model:
Sell – Signal generated on the close of October 12 (click here for more details)
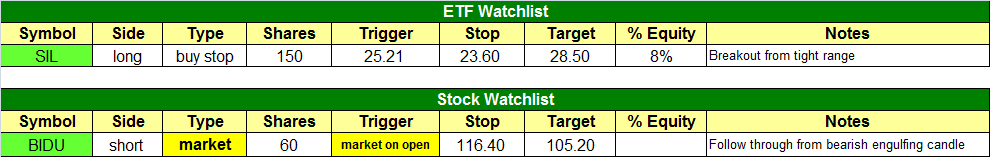
today’s watchlist (potential trade entries):
Having trouble seeing the open positions graphic above? Click here to view it directly on your web browser instead.
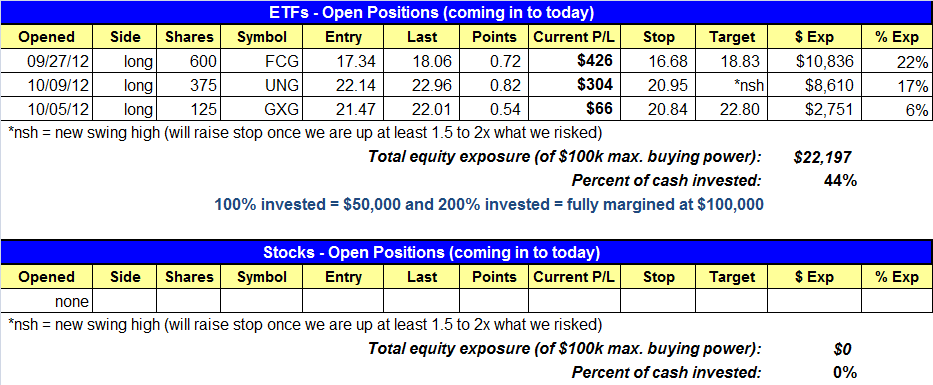
open positions:
Below is an overview of all open positions, as well as a report on all positions that were closed only since the previous day’s newsletter. Net P/L figures are based on two separate $50,000 model portfolios (one for ETFs and one for stocks). Changes to open positions since the previous report are listed in pink shaded cells below. Be sure to read the Wagner Daily subscriber guide for important, automatic rules on trade entries and exits.
Having trouble seeing the open positions graphic above? Click here to view it directly on your web browser instead.
closed positions:

Having trouble seeing the closed positions graphic above? Click here to view it directly on your web browser instead.
ETF position notes:
- No trades were made.
stock position notes:
- No trades were made.
ETF and broad market commentary:
After two hours of see-saw price action, stocks broke out to new intraday highs across the board just after 12 pm. However, around 12:30 pm, a disappointing earnings report from GOOG which was released ahead of schedule sent the tech giant tumbling 10% lower in short order before trading was halted. The Nasdaq Composite and Nasdaq 100 sold off sharply in reaction and took on water the rest of the session before bouncing off the lows into the close. The S&P 500 was able to shake off the news and return back into the opening hour range as was the Dow. Both the S&P Midcap 400 Index and Dow Jones Industrial Average ($DJIA) held up the best only giving back 0.1%. The S&P 500 Index ($SPX) shed 0.2%. The small-cap Russell 2000 Index ($RUT) lost 0.6%, while the Nasdaq Composite dropped 1.0%.
Thursday was the first clear cut day of distribution for both the Nasdsaq and NYSE, as volume swelled 15% on the Nasdaq and 8% on the NYSE. The volume total on the Nasdaq was easily the highest since the topping reversal bar of September 21. Although the NYSE volume total was not as high, Thursday’s volume was greater than all three accumulation days this week. The NYSE Adv/Decl ratio finished at approx. 1 to 1, while the Nasdaq Adv/Decl ratio closed at approx. 2 to 1. While this was the first obvious day of selling in the S&P 500, this is was the second day of selling in the Nasdaq. We did mention in yesterday’s report that one could argue that the Nasdaq ran into some profit taking at the 50-day moving average (churning).
Earlier this week we posted a chart of CurrencyShares Euro Trust ($FXE), showing a bullish consolidation above the 200-day moving average. The weekly chart below shows the break of a year long downtrend line on a pick up in volume. With the strong move off the lows, the price action should continue to consolidate in a tight range and ideally not retrace more than 38% of the move measured from 7/27 to 9/14. Currently the lows of the consolidation is only 33% off the highs of the move.

We are monitoring $FXE for a low risk entry point on a pullback, especially if the price action can test the rising 20-day EMA and form a higher low. The action doesn’t have to pullback and could just drift sideways for a day or two before breaking out above the 10/17 high.

Global X Silver Miners ETF ($SIL) has held up well the past two weeks and is forming a tight-ranged consolidation near the highs of the last move. $SIL exploded off the lows of August before stalling at resistance from the highs of late February 2012. The powerful trend reversing move was confirmed by a bullish moving average crossover as well, as the 50-day MA is now above the 200-day MA and both averages are pointing in the right direction.

The Nasdaq’s performance on Thursday clearly shows that the market is fragmented. We can’t expect much from the S&P 500 if the Nasdaq is not on board. Over the past few weeks two key Nasdaq leadership stocks, GOOG and AAPL, have broken down below the 50-day MA. These leaders are being replaced this week by insurance and utility stocks….this is not the type of rotation that inspires confidence.
stock commentary:
Stocks breaking down this week from our top internal relative strength list are: GOOG MLNX LNKD PCRX CYBC ELLI EQIX MDVN DSW SCSS NTCT. These stocks join AMZN, AAPL, and CRUS below the 50-day MA.
With the market yet to flash a buy signal we remain 100% in cash with the potential for one or two short-term short positions if they come along from the Nasdaq 100. $BIDU is an official short setup in tonight’s report with reduced share size. We are looking to go short based on yesterday’s ugly reversal action. We are shorting at market on the open, provided that the open is greater than or equal to 112.00. This means we will take our position (sell short BIDU) right away on the open. The stop is over yesterday’s high.
If you are a new subscriber, please e-mail [email protected] with any questions regarding our trading strategy, money management, or how to make the most out of this report.
relative strength combo watchlist:
Our Relative Strength Combo Watchlist makes it easy for subscribers to import data into their own scanning software, such as Tradestation, Interactive Brokers, and TC2000. This list is comprised of the strongest stocks (technically and fundamentally) in the market over the past six to 12 months. The scan is updated every Sunday, and this week’s RS Combo Watchlist can be downloaded by logging in to the Members Area of our web site.