market timing model:
Buy – Signal generated on the close of November 23 (click here for more details)
today’s watchlist (potential trade entries):

Having trouble seeing the open positions graphic above? Click here to view it directly on your web browser instead.
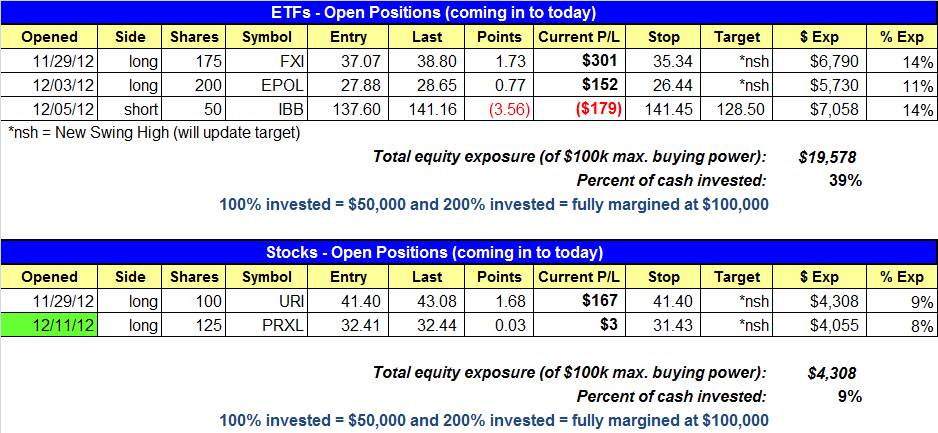
open positions:
Below is an overview of all open positions, as well as a report on all positions that were closed only since the previous day’s newsletter. Net P/L figures are based on two separate $50,000 model portfolios (one for ETFs and one for stocks). Changes to open positions since the previous report are listed in pink shaded cells below. Be sure to read the Wagner Daily subscriber guide for important, automatic rules on trade entries and exits.
Having trouble seeing the open positions graphic above? Click here to view it directly on your web browser instead.
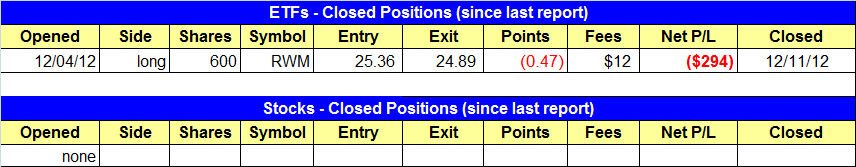
closed positions:
Having trouble seeing the closed positions graphic above? Click here to view it directly on your web browser instead.
ETF position notes:
- $RWM protective sell stop triggered and we are out.
stock position notes:
- $PRXL buy stop triggered.
ETF and broad market commentary:
After gapping higher on yesterday’s open, stocks initially built on their morning gains, but a pullback in the final 90 minutes of trading caused the major indices to surrender a significant portion of their intraday gains and finish near their lows of the day. Nevertheless, the Nasdaq Composite still jumped 1.2% and reclaimed its 50-day moving average. Both the S&P 500 and Dow Jones Industrial Average advanced approximately 0.6%. The small-cap Russell 2000 kept pace with the Nasdaq, but the S&P Midcap 400 Index showed a bit of relative weakness by settling just 0.5% higher. Total volume in both exchanges was firmly higher than the previous day’s levels, but the weak closing price action hinted at institutional selling into strength (“churning”).
After forming a bullish reversal candle off support of a prior breakout level, iShares Msci Poland ($EPOL) has followed through nicely to the upside the past two days. The recent pullback in $EPOL is a good example of where to find a low risk entry point after a stock/ETF has already broken out using the high and low of the candle as an entry and stop. It can also serve as a low risk point to add to a position because of the tight stop beneath the reversal candle low. We did not add to our position in $EPOL because we are trading with reduced share size and did not want to increase risk.

iShares Silver ETF ($SLV) is currently basing out and could trigger a buy entry sometime this week if it can climb back above the 50-day MA and the high of December 10. $SLV is not an official buy setup right now, but we are monitoring the action as long as it holds above the 31.50 area. We will no longer be interested in the trade if $SLV breaks down and stays below the December 5 low.

As the holiday season draws nearer, overall volume levels are expected to dry up as well. When turnover slides below 50-day average levels, equities are more susceptible to erratic, whipsaw price action. If you’re a new trader, don’t underestimate the importance of having solid turnover levels in the market, as volume is the fuel that enables trends to become firmly established. Without it, noncommittal, choppy sessions are common. Therefore, despite yesterday’s breakout action in several of the main stock market indexes, we caution against becoming overly complacent or aggressive with share size at current levels. Keep in mind that our market timing model has been in “buy” mode since November 23, but the technical signals have not yet been generated to cause our timing system to shift to “confirmed buy” mode.
stock commentary:
$PRXL buy entry triggered yesterday. For those who took the unoffical buy setup in $CRM you may want to sell into strength to lock in gains.
There is one new official setup on today’s watchlist in $VMC. After a solid breakout, $VMC has pulled back the past two weeks and is poised to resume its uptrend on a move above Tuesday’s high.
$NTE, $CX, $SNTS, and $VAC are decent buy candidates as well, but now is not the time to get aggressive. For example, if $VMC triggers we will have three open longs with total risk of about $280 ($URI stop is breakeven).
If you are a new subscriber, please e-mail [email protected] with any questions regarding our trading strategy, money management, or how to make the most out of this report.
relative strength combo watchlist:
Our Relative Strength Combo Watchlist makes it easy for subscribers to import data into their own scanning software, such as Tradestation, Interactive Brokers, and TC2000. This list is comprised of the strongest stocks (technically and fundamentally) in the market over the past six to 12 months. The scan is updated every Sunday, and this week’s RS Combo Watchlist can be downloaded by logging in to the Members Area of our web site.