Current signal generated on close of Feb. 13.
Portfolio exposure can be anywhere from 50% to 100% long (or more), depending on how open positions have held up.
Past signals:
- Sell signal generated on close of February 3.
- Neutral signal generated on close of January 24.
- Buy signal generated on close of November 13
- Buy signal generated on close of September 9
- Neutral signal generated on close of August 15
- Buy signal generated on close of July 11
- Neutral signal generated on close of July 5
- Sell signal generated on close of June 24
today’s watchlist (potential trade entries):

Having trouble seeing the open positions graphic above? Click here to view it directly on your web browser instead.
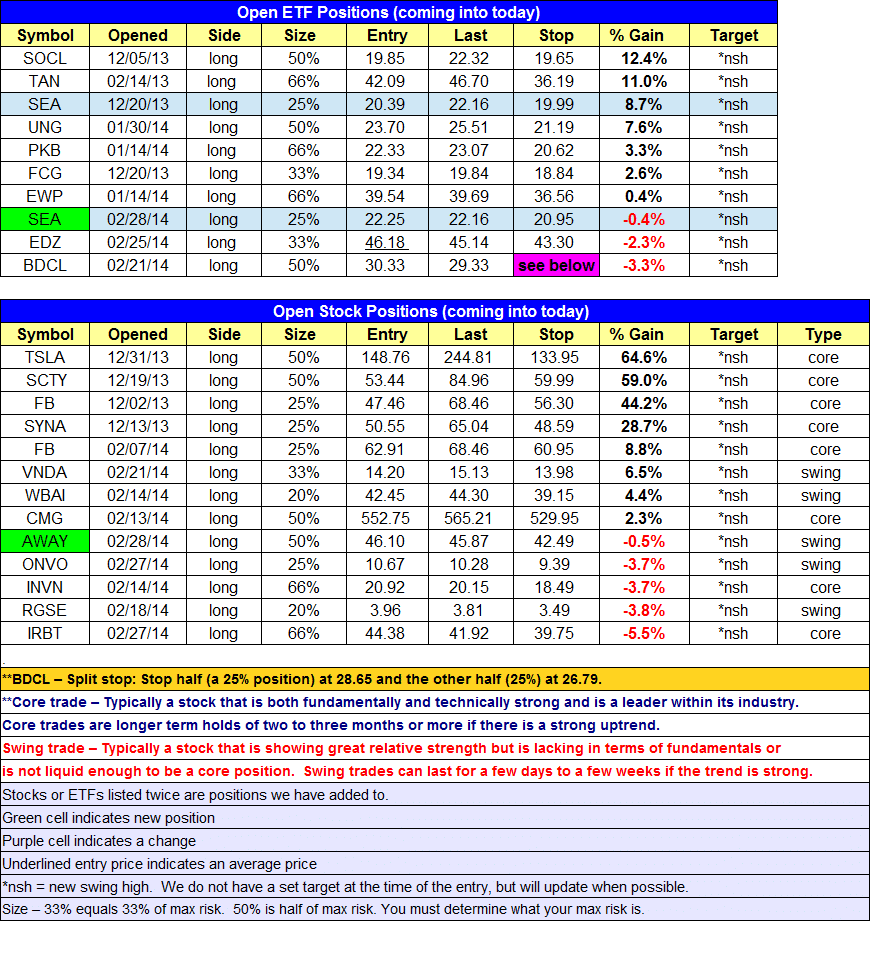
Below is an overview of all open positions, as well as a report on all positions that were closed only since the previous day’s newsletter. Changes to open positions since the previous report are listed in pink shaded cells below. Be sure to read the Wagner Daily subscriber guide for important, automatic rules on trade entries and exits.
Having trouble seeing the open positions graphic above? Click here to view it directly on your web browser instead.
closed positions:

Having trouble seeing the closed positions graphic above? Click here to view it directly on your web browser instead.
ETF position notes:
- The 25% add to our long position in $SEA triggered over the 5-minute high.
stock position notes:
- $AWAY pullback entry triggered (buy stop entry was to be canceled).$GERN sell stop triggered on the smaller 16% position.
ETF, stock, and broad market commentary:
Last week’s action was dominated by stalling action, with most averages gaining ground in the morning but selling off late in the day. Friday’s session followed the same script, but the afternoon selling was more intense, with the main averages declining 1% or more off the highs of the day before bouncing in the final hour of trading.
Turnover increased on both exchanges, producing a distribution day on the Nasdaq Composite and churning action on the S&P 500. If Friday’s close would have been at the lows of the day, then it would have been a nasty reversal, but the late bounce removed some of the sting.
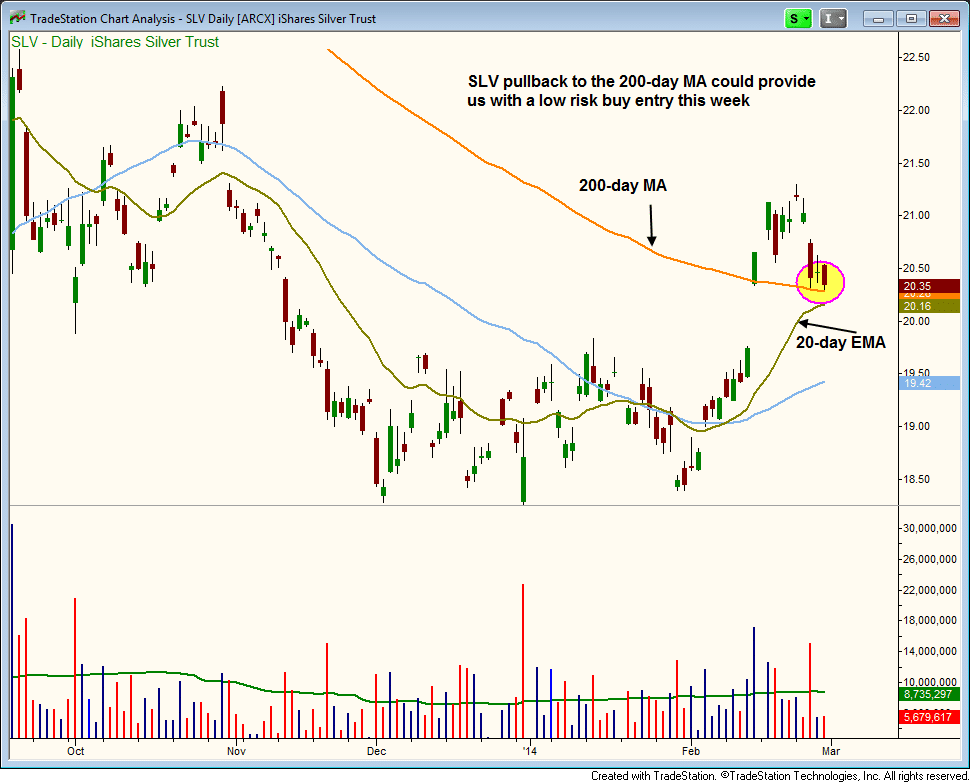
Silver ETF ($SLV) is in pullback mode after a strong rally off the lows. A shakeout below the 200-day MA could provide us with a low risk entry point, especially if that shakeout dips below the rising 20-day EMA and forms a bullish reversal candle.
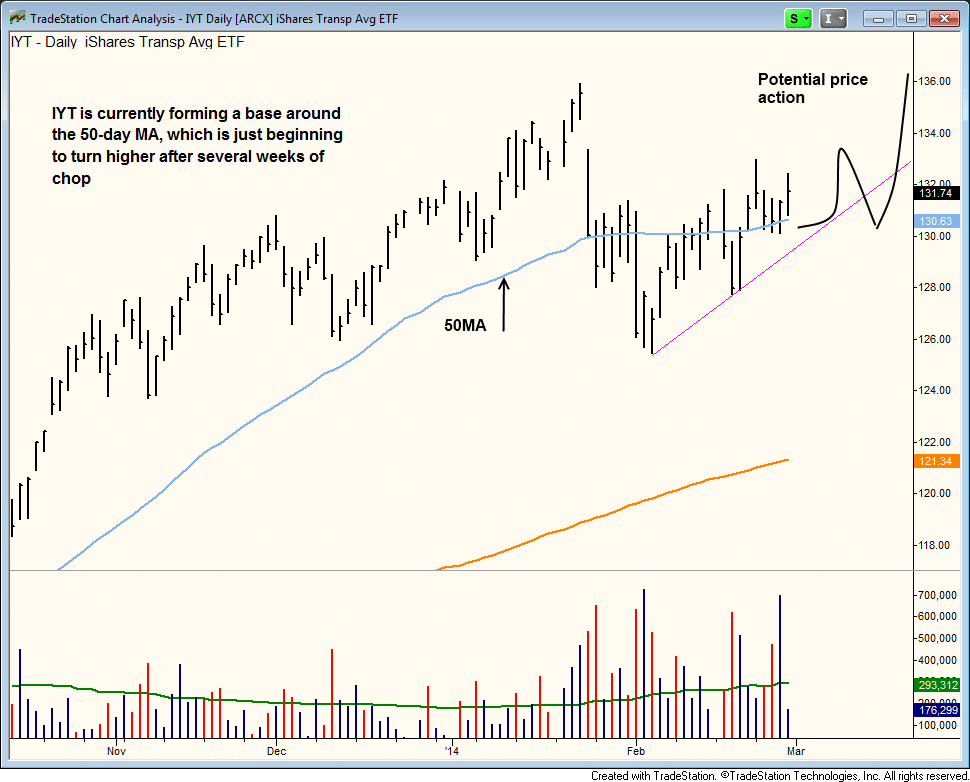
Dow Jones Transportation Average ($IYT) has been consolidating in a tight range the past few weeks, forming a base around the 50-day MA. Notice that the 50-day MA has begun to turn up. If the price action can continue to hold the 50-day MA, then $IYT might be in play on the long side soon. We drew in the ideal price action over the next few weeks.
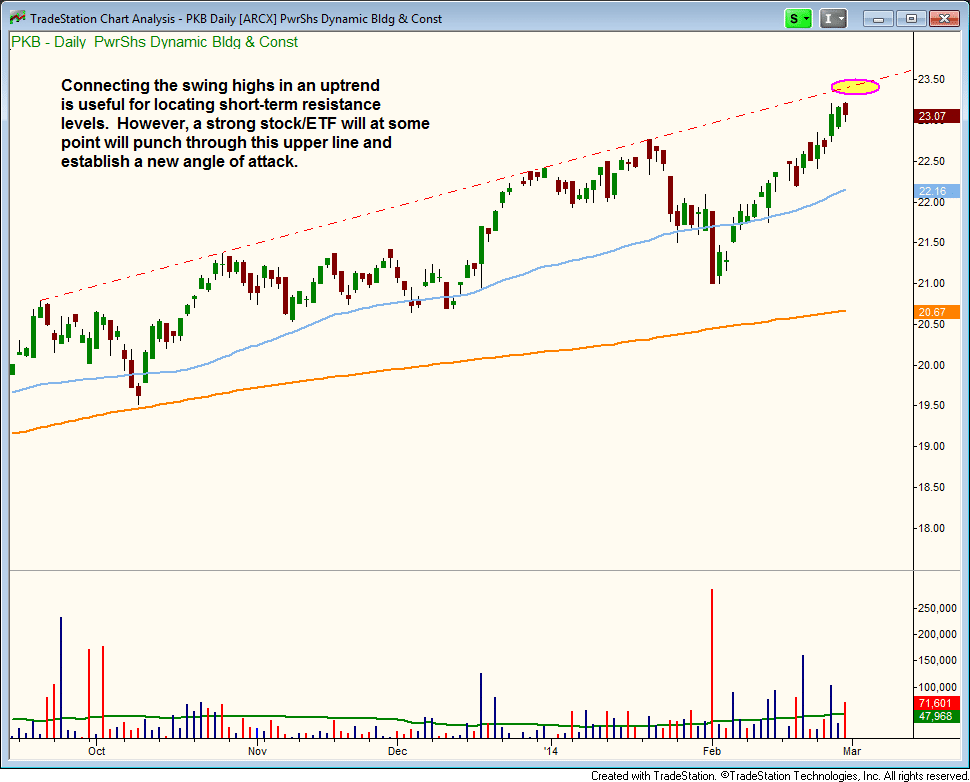
We remain long PowerShares Building and Construction ($PKB) in our ETF portfolio, but the price action is closing in on resistance from a trendline drawn connecting swing highs. Most traders focus on uptrend lines connecting swing lows, but an uptrendline at the highs is useful for position traders who want to sell partial size into strength and wait for a pullback to develop.
On the stock side, we entered one new position in $AWAY last Friday, which triggered the pullback entry. The other setup on a buy stop is to be canceled.
There are no new setups for today and please cancel the second half of the $GERN trade as well.
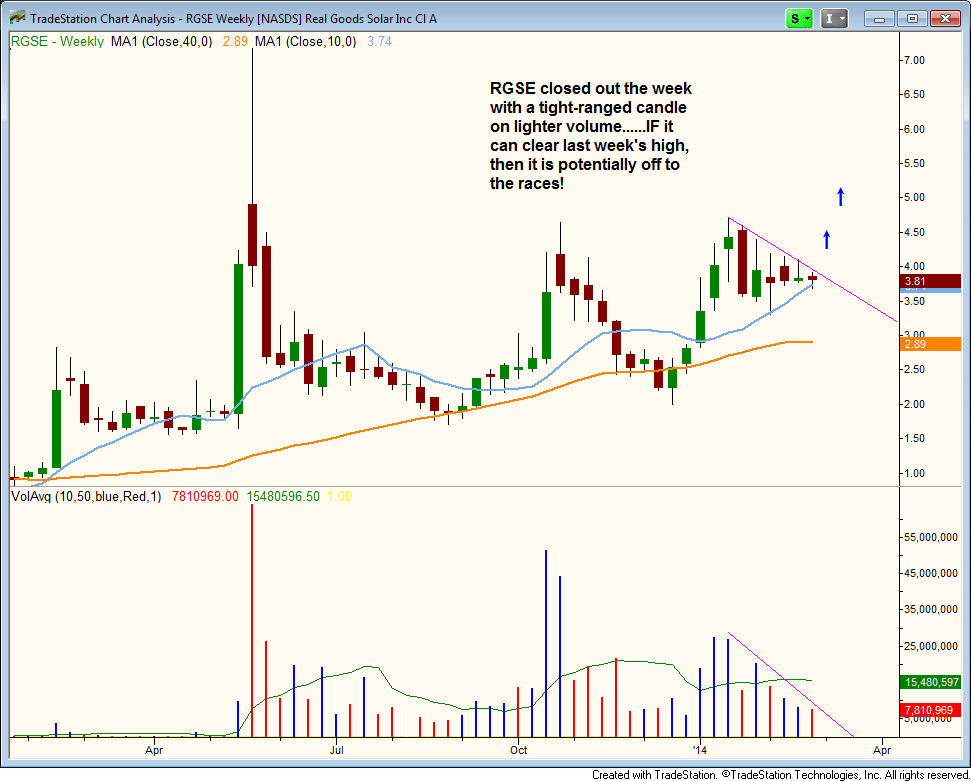
We remain long $RGSE, and with last week’s tight price action at the 10-week MA on light volume, we should eventually see a strong move out. Anything can happen, but $RGSE looks great.
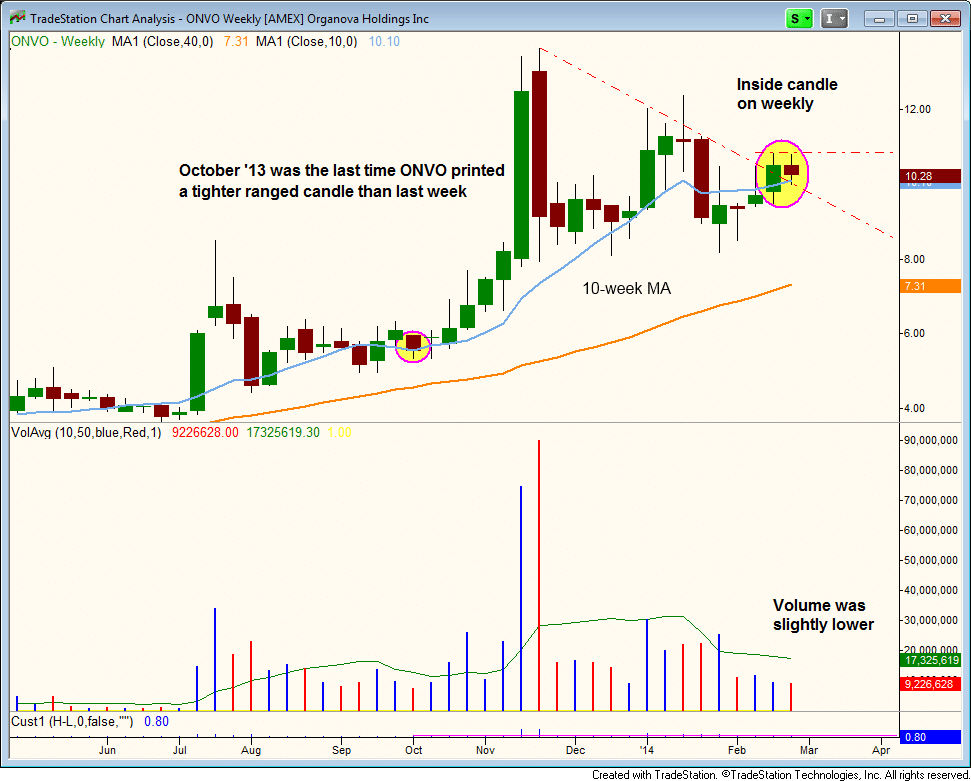
$ONVO is another stock with a very tight weekly chart that we currently own. A move above the two-week high should send the price action to new highs in short order.
