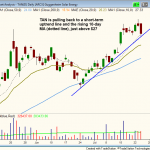
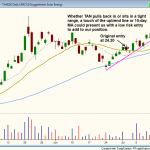
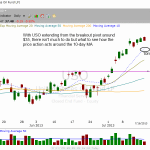
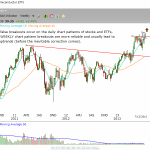
Not much to talk about in terms of new setups in ETFs. We continue to hold $FDN and $USO with tight stops on partial size below yesterday’s low. Please note the changes to the protective sell stop in $FDN. After a false breakout from a bull flag, $TAN has pulled back to a short-term uptrend line and the rising 10-day MA. We look for $TAN to find support at or around this level by the end of the week

Continue Reading...

We are trend traders and prefer to see confirmation of a new trend emerge before we take any action. For example, before we enter a stock/ETF we look for the 50-day MA to be in an uptrend and near or above the 200-day MA, which should at the very least be flattening out (not going lower). Both gold and silver ETFs are still in a clear downtrend, with the 50-day MA yet to turn up, so it is simply too early for us to get involved. Looking at the monthly chart of Global X Uranium ETF ($URA), we could potentially see a reversal of trend by the end of the month if the price action can close above the two-month high and the downtrend line.

Continue Reading...

Per yesterday’s commentary, there hasn’t been a whole lot to do on the ETF side the past few days due to the dry up in setups from our scans. Most open ETF positions are either a bit too extended to add to the position, or have just broken out and need more time to confirm the breakout. However, we are stalking the Claymore/MAC Global Solar Index ($TAN) for a potential pullback entry if it can touch the rising 10-day MA or short-term uptrend line on the daily chart below

Continue Reading...

Our recent breakout entries in $USO and $FDN remain in great shape. Both ETFs have followed through to the upside nicely, and have extended well beyond their entry points. When an ETF or stock breaks out and runs higher for several days in a row, there is a temptation to sell right away and book profits. While it may be wise to take a quick profit from a swing trade entered on a short-term pullback in a uptrend, both of these ETFs have broken out from valid basing patterns and could run higher for several weeks before consolidating again. So there isn’t much to do now with either $USO or $FDN, as we wait for the 10-day MA to catch up to the price action.

Continue Reading...

$IHI broke out from a two year long consolidation at the beginning of the year. After stalling out at $76 and chopping around for a few months, $IHI has formed a tight base on top of the last base during the past 8-weeks. Note the strong support at the 10-week MA, which is where the past two consolidations have found support. We often see short consolidations form after a stock or ETF breaks out from a long base. The weekly chart below is a good example of this

Continue Reading...

After the July 11 breakout, we wanted to wait for additional confirmation that the breakout was going to hold before before buying it. When a trade setup is based on a weekly chart timeframe, we simply look for a weekly closing price above resistance of the breakout. Since the price closed above resistance of the breakout level on the weekly chart last Friday, $SMH is NOW an ideal intermediate-term ETF trade candidate. Because of this, subscribing members should note our specific entry, stop, and target prices for this SMH trade setup on today’s watchlist:

Continue Reading...

Merrill Lynch Semiconductors HOLDRS ($SMH) hit a new closing high for the year on the daily chart yesterday, and if it can close above 39.28 tomorrow, then it will also have broken out from an 8-week consolidation at the highs. The current 8-week base has held above the highs of the last base, which was two years long. Usually when a stock or ETF breaks out from a long base, the first correction after a big breakout is shorter in time and much more shallow (which is exactly what $SMH has done on the chart below).

Continue Reading...