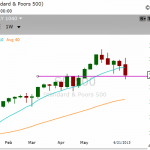
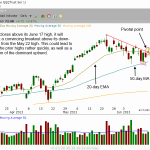
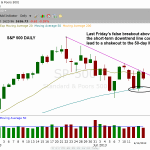
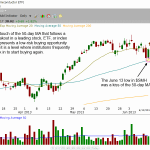
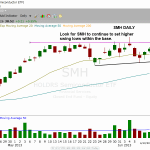
During a corrective phase in a bull market, price action should find support at the highs of the last valid base (resistance turns in to support). All major averages are pulling back in to the highs of the last base. On the weekly charts below, current price action is pulling back in to support of the highs of the last base, which is the purple horizontal line. We view support as more of an area rather than just one line, so as long as the price action holds at or around this level it is bullish.

Continue Reading...

Thursday’s bearish price and volume action did quite a bit of technical damage to the daily charts, as all major averages are now trading below the prior swing low and the 50-day MA, signaling the uptrend is in danger of reversing. Because the prior swing lows have been broken, the averages are no longer making higher swing lows, which forces our timing model back in to neutral mode (we have a simple rule in place where can’t establish new longs when the market is breakding down and setting lower highs and lower lows). Without a swing low in place, adding long exposure is not an option, especially when the volume patterns are once again turning negative on the NYSE and NASDAQ.

Continue Reading...

In early May, we sold short spot gold through buying Gold Double Short ($DZZ), an inversely correlated “short ETF.” The trade worked out well, as we sold short gold when it bounced into resistance of its 20-day exponential moving average, which followed a massive break of key support. We subsequently covered about two weeks later for a gain of nearly 10%. Since closing that trade, gold has been oscillating in a range, near its lows, and is now poised to once again break down below a key level of support. This is shown on the daily chart of SPDR Gold Trust ($GLD) below:

Continue Reading...

he Fed will release its decision on rates tomorrow afternoon, so as usual, we can expect a pick up in volatility in the final 90 minutes of trading. For those who trade the plan and come in prepared, Fed days are not such a big deal. However, for some traders, the last 90 minutes of trading on a Fed day can turn in to a roller coaster ride. Emotional based decision making hardly ever works, so we always recommend planning the trade in advance and sticking to that plan during the day. Guggenheim Solar ETF ($TAN) remains on our watchlist, but we are monitoring the action for a potential pullback entry if it can hold support at the 20-day EMA around $24

Continue Reading...

If the answer to all the above is yes, then conditions are improving and a new bull market is potentially under way. However, the bull market can not be confirmed until leading stocks break out on solid price and volume action. Yesterday’s false breakout above the downtrend line in the S&P 500 could spark a short-term pullback to the 50-day MA, and we could potentially see an undercut of last Thursday’s low. However, as long as the low of June 6 holds and the market avoids distribution (heavy selling), then the timing model will remain on a buy signal.

Continue Reading...

As the broad market has been consolidating and digesting its recent gains over the past month, $SMH has been holding up well and we remain long our partial position from the May 23 entry. However, now that the 50-day moving average has finally risen to meet the price of $SMH, we are also prepared to add to the position, in anticipation of a pending resumption of its new uptrend and a breakout to a new 52-week high. Below is the daily chart pattern of $SMH.

Continue Reading...

Here are a few ETFs that are holding up well as of late (aside from $TAN and $SMH). After breaking about above $30, Technology Select Sector SPDR ($XLK) stalled at the prior highs of 2012 a few weeks ago. Since then is has consolidated in a tight, sideways range above the rising 10-week MA. $XLK will need a few more weeks of basing aciton (as do most ETF/stocks), so the chart is not actionable.

Continue Reading...