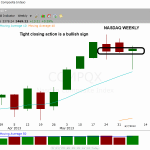
he weekly chart of the Nasdaq Composite below shows the tight closing action over the past few weeks.
he weekly chart of the Nasdaq Composite below shows the tight closing action over the past few weeks.
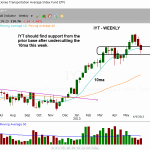
We are not ready to call a bottom in the market but Thursday’s action was a good start. Our timing model remains in buy mode, but there are very few (if any) actionable setups in A rated stocks or top relative strength ETFs that are ready to break out within the next few days. Patience is key as we wait for new buy setups to develop. When the market is in pullback mode within a strong uptrend, prior bases in stocks and ETFs should serve as a logical support area. The recent pullback in $IYT is a good example of a prior base that should provide support. The recent breakout in $IYT stalled in mid-May, so the current pullback should find support from the upper half of the last base and the rising 50-day MA.
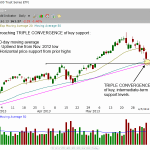
he good news about the current state of the broad market is that the benchmark S&P 500 Index is now nearing triple convergence of key support levels: intermediate-term support of its 50-day moving average, the long-term uptrend line from its November 2012 low, and a substantial level of horizontal price support. Below, this is annotated on the daily chart of S&P 500 SPDR ($SPY), a popular ETF proxy for the S&P 500 Index
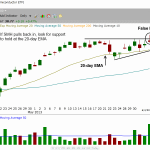
A stalled breakout attempt in Merrill Lynch Semiconductors HOLDRS ETF ($SMH) led to a close in the bottom 20% of the day’s range. If Tuesday’s low does not hold over the next two days, then we would expect a short-term pullback to the 20-day EMA. Because of this, we are lowering our stop back down to the original stop point to give the setup some breathing room (around the 20-day EMA). Since we sold 2/3 of our position on the move up, we don’t mind holding on to the rest of the position with a loose stop placed beneath the swing low of 5/23.
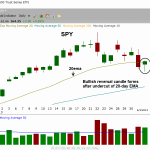
Volume confirmed yesterday’s price action, as turnover increased on both exchanges. NYSE volume was less than 1% higher, but Nasdaq volume increased by 6%. The positive close on higher volume produced a much needed accumulation day for both the Nasdaq and S&P 500. After undercutting Friday’s low and the 20-day EMA, S&P 500 ETF ($SPY) rallied to close above the 20-day EMA and the prior swing low on May 23
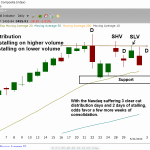
Of all the technical indicators at our disposal, volume (and obviously price) is the most important indicator to follow. When stocks are moving higher on increasing volume, it indicates support among institutional players. Conversely, the presence of higher volume selling indicates that the “big boys” are selling. Since institutional trading accounts for more than 50% of the stock market’s average daily volume in any given day, the bias among institutional players always has a direct impact on the subsequent direction of the market. biggest concern in the market right now is not that stocks are pulling back from their highs, but that they are doing so on higher volume, along with several instances of “stalling” price action. The daily chart of the NASDAQ below illustrates this
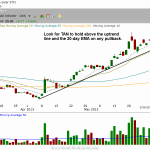
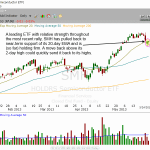
After finding support around $23, Claymore/MAC Global Solar Index ($TAN) continues to push higher above the rising 10-day MA. The daily chart below details the support in $TAN.
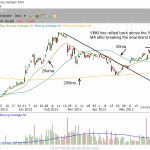
ur ETF scans have not produced much in the way of actionable setups as of late, with most markets still extended in the short-term and in need of a few more weeks of consolidation. Market Vectors Vietnam ETF ($VNM) is a good example of this, as it needs another week or two of sideways action (above $20) to produce a low risk buy setup.

Bonds have been taking a beating the past few weeks, as evidenced by the sharp reversal in $TLT off the highs of April. If $TLT cracks support at $115 – $116 it could be headed for the $110 area. With interest rates climbing, sitting in bonds while the market climbs higher will be a tough pill to swallow for many.
market timing model: Buy – Signal generated on the close of April 30 We are now in confirmed buy mode, which means that we can go on margin if needed. (click here for more details) today’s watchlist (potential trade entries): Having trouble seeing the open positions graphic above? Click here to view it directly […]