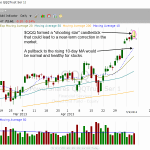
After trading slightly lower and in a tight, sideways range throughout the first half of the day, stocks staged a rally attempt just after mid-day, but the buying interest was short-lived and the broad market drifted back down. The Nasdaq Composite dipped just 0.1%, but turnover in the exchange ticked 5% higher. Although the Nasdaq’s loss was not enough to count as a “distribution day,” the session was definitely indicative of bearish churning (stealth institutional selling into strength). The S&P 500 lost 0.4%, but on volume that was a bit lower than the previous day’s level. Because the broad market rallied in the early afternoon, but failed to hold onto those intraday gains into the close, several of the major indices formed a candlestick pattern known as a shooting star, a bearish reversal pattern that often precedes a near-term correction within an uptrend.

Continue Reading...

With the market extended in the short-term, our scans have not produced much in the way of actionable setups the past few days. We continue to monitor the action in the solar ETF ($TAN) for a low risk entry point. iShares North American Tech-Software ETF ($IGV) has also caught our eye after breaking out from a two year long consolidation. The monthly chart shows the recent breakout, followed by two months of basing action above the highs of the prior range.

Continue Reading...

After a strong rally off the 50-day MA, Merrill Lynch Semiconductors HOLDRS ETF ($SMH) has stalled out at the $38 level the past few days. Whenever a stock or ETF breaks out and runs higher with very little rest, if possible, we like to draw a steep uptrend line to give us an idea of where potential intraday pullbacks should find support. A trend line becomes valid when there are at least 1 or 2 touches after the first two points have been established. The longer the trend line holds, the more valid it becomes.

Continue Reading...

Claymore/MAC Global Solar Index ($TAN) is in the process of forming the “right side” of the base. Looking at the weekly chart below, we see that the price action has reversed higher off support at $15, On the daily chart, we see that there was a bullish crossover signal with the 50-day MA crossing above the 200-day MA back in February. After breaking the downtrend line of the base in early April, $TAN rallied back above the 200 and 50-day MAs, and is now trading in a tight range just below the base high. Ideally, we’d love to see a few more weeks of basing action before $TAN hits new highs. This basing action is known as a handle, which should drift lower and have a few shakeout days.

Continue Reading...

Aside from tech-related ETFs like $SMH, another group showing leadership is international ETFs. More specifically, select emerging markets in Asia are the top dogs. We remain long iShares Indonesia Fund ($EIDO), which pulled back in the latter half of last week, but is now sitting near support of its prior breakout level. The iShares Thailand Index ($THD) demonstrated similar price action, and we are monitoring it on our internal watchlist for possible buy entry in the coming days. The iShares Philippines Index ($EPHE) remains incredibly strong, but is rather extended from price support on its weekly chart.

Continue Reading...

The current market rally continues to build steam, led by the relative strength in the Nasdaq Composite, as it pulls away from the 3,300 breakout level. The Nasdaq rallied 1.3% on Thursday, and is the only index to have broken out to new swing highs. The S&P 500 rallied 0.9%, and the Russell 2000 closed back above the 50-day MA with a solid 1.7% advance. Volume was light on both exchanges, which prevented the averages from logging an official accumulation day, but we saw plenty of solid buying in leading stocks. Natural Gas ETF ($UNG) was hit hard on Thursday, dropping 6% on heavy volume. With the price action breaking the bullish reversal candle low of 4/26 and the 20-day EMA, $UNG may need a few more weeks of consolidation before it can head higher. There is support from the 10-week moving average on the weekly chart below. The 50-day MA on a daily chart is slightly lower at 21.42.

Continue Reading...

One ETF on our radar screen for potential buy entry is First Trust Internet Index ($FDN). Unlike many of the strongest ETFs in the market that are near-term extended to the upside, $FDN has not yet broken out above its range. As such, one could understandably argue that the ETF has relative weakness and should be avoided. In many cases, that would be true. However, the difference here is that $FDN has been forming a constructive base of consolidation at its all-time highs. This is much different than buying an ETF that is trading near its lows and is only now attempting to reverse its downtrend. The weekly chart of $FDN below shows how the ETF has been consolidating for the past few months:

Continue Reading...

Building on the momentum from Monday’s breakout to new highs, the Nasdaq Composite rallied 0.7% on heavy volume. The S&P 500 and S&P Midcap 400 joined the Nasdaq by setting new highs as well. Turnover was also higher on the NYSE, confirming the breakout in the S&P 500. After a two day shakeout below the 50-day moving average, the Nasdaq Composite has ripped to new highs with gains in 7 of the past 8 sessions. Clearly, buying the dip is still in vogue, with every significant pullback to the 50-day MA quickly leading to new highs in the Nasdaq this year.

Continue Reading...

Rotation has been the key to this year’s resilient rally. Whenever a leading group has cooled off a new group has emerged. In early 2013, financials, construction, and energy stocks pushed the S&P 500 higher. Over the past few weeks we have seen money flow into the Nasdaq, with semiconductor stocks leading the way by breaking out to new highs ahead of the Nasdaq. Another key to the rally has been the constructive price action of leading groups after selling off from an extended run. Transports and financials made big runs during the first quarter, but have since been in consolidation mode, forming bullish basing patterns. iShares Dow Jones Transportation Average ($IYT) has formed a bullish base on the weekly chart, holding support of the rising 10-week moving average (in teal).

Continue Reading...

In last Friday’s newsletter, we highlighted SPDR Gold Trust ($GLD) as a potential short entry as it bounced substantially off its recent lows and into near-term resistance. Specifically, recall we were looking for a short entry if $GLD fell below the prior day’s low. Although $GLD did not trade below the prior day’s low on Friday, it came within 25 cents (0.2%) of doing so. Going into today, the trade setup still looks quite good. In fact, a short entry into $GLD is now a slightly lower risk entry point because the ETF “overcut” resistance of its 20-day exponential moving average on an intraday basis, then closed well below it AND in the lower third of its intraday trading range. This is shown on the updated daily chart of $GLD below.

Continue Reading...