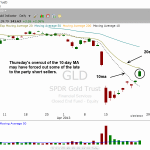
After an ugly, two day meltdown in the SPDR Gold Trust ETF ($GLD), the price action has bounced higher the past two weeks and over-cut the 10-day moving average. Thursday’s candle may have wiped out some of the “late to the party” short sellers, who attempted to go short beneath the low of 4/22 on 4/23. Thursday’s gap up may have forced anyone who was on the fence about covering to throw in the towel by the close.

Continue Reading...

As part of our “top-down” strategy for ETF trading (as described in Deron’s ETF trading books), the next step to do upon determining which major index is showing the most relative strength is to drill down and find the specific sector ETFs with the most relative strength to the broader index. A good example of this can be found by looking at the recent price action of Market Vectors Semiconductor ETF ($SMH). Despite the Nasdaq Composite being completely flat yesterday, $SMH still gained 1.0%. On a more significant technical level, the ETF broke out above a 3-month base of consolidation to close at a fresh 52-week high. This is shown on the daily chart of $SMH

Continue Reading...

Although the timing model is on sell signal, the price action in leadership stocks since 4/18 has been bullish. ETFs that led the market higher during the last rally such as $XLF and $ITB are no longer leading, but they are holding up. As long as we continue to see leadership rotate, then we have to believe that the market has more upside. iShares Dow Jones US Home Construction ETF ($ITB) reclaimed its 50-day MA yesterday on higher volume. The swing low from February is holding up, and as long as $ITB continues to set higher swing lows within a base, then we have to view the price action as constructive.

Continue Reading...

Led by solid gains in the Nasdaq 100 and Nasdaq Composite, stocks closed higher across the board. The Nasdaq complex easily outperformed the S&P 500 on Monday, signaling that money is beginning to rotate out of the S&P 500 (and Dow) and in to the Nasdaq. Over the past two sessions, the Nasdaq has climbed about 2.5% off last Thursday’s low; however, volume has declined the past two sessions, failing to confirm the move. The Nasdaq may need a bit more time to consolidate, as there is quite a bit of overhead resistance. Looking at the daily chart of the Nasdaq 100 ETF ($QQQ) below, we see price action running in to resistance clustered around 69.00.

Continue Reading...

Presently, most of the best looking ETFs are international ETFs. More specifically, they are Asian ETFs. Going into today, iShares Indonesia ETF ($EIDO) remains on our watchlist as a potential buy entry. While the S&P 500 shed more than 2% last week, $EIDO actually gained just over 2%. This bullish weekly divergence in $EIDO of more than 4%, compared to the S&P 500, indicates high relative strength in this ETF. Furthermore, the $EIDO is now poised to break out above the highs of a 7-week base of consolidation. Our trigger price for buy entry is listed on today’s watchlist, but please note that our standard gap rules do NOT apply with the $EIDO trade setup. This means that even if $EIDO opens more than 1.3% above our trigger price, we will still buy on the open (at market).

Continue Reading...

Stocks continued to sell off on Thursday with tech stocks getting hit the hardest. The Nasdaq Composite sold off -1.2% while most averages closed in the -0.6% to -0.7% range. The Nasdaq sliced through its 50-day moving average, joining the Russell 2000 and S&P Midcap 400. The S&P 500 closed just below (but not a decisive break of) its 50-day moving average yesterday after undercutting prior swing lows at the 1538-1539 support level:

Continue Reading...

With the S&P 500 still holding the 50-day MA the timing model remains in neutral. A close below the 50-day MA in the S&P (with the Nasdaq already below the 50ma) would generate a sell signal in the timing model. Rather than looking at individual ETF trade setups in a market that has not exactly been conducive to new trade lately, let’s instead check out the current technical support and resistance levels of a few broad-based ETFs that track the main stock market indexes. First up is the daily chart of S&P 500 SPDR ($SPY), an ETF that tracks the benchmark S&P 500 Index:

Continue Reading...

Leading stocks appear to be holding up as well, with $LNKD, $AMZN, $TSLA, $EBAY, $AMBA, $CELG, and $PRLB (to name a few) either holding steady or finding support at logical levels. Homebuilders and transportation stocks have not impressed as of late, but they continue to base out and that is a good sign (check out $ITB and $IYR). While money has flowed out of BRIC ETFs (Brazil, Russia, India, China), Southeast Asia continues to be a hot spot with bullish chart patterns in Indonesia ($EIDO), Thailand ($THD), and Singapore ($EWS). The first two ETFs ($EIDO and $THD) are official setups on today’s watchlist. iShares MSCI Thailand ($THD) has formed a bullish basing pattern during the past five weeks.

Continue Reading...

With the S&P 500 and Nasdaq Composite failing recent breakouts, along with the Russell 2000 and S&P 400 breaking down below the 50-day MA, the timing model shifts in to neutral. As with the last sell signal, we will have to see how stocks react over the next few days to determine if the rally is dead. If leading stocks and major averages follow through to the downside within the next few days, then the model will be forced in to sell mode.

Continue Reading...

For the past year and a half, $GLD had merely been oscillating in a range, near its all-time highs. However, the ETF formed several “lower highs” during this time, while firmly holding pivotal horizontal price support at the $150 level. This led to the creation of a descending triangle chart pattern during that time, which may have started to follow-through to the downside. On the annotated weekly chart of $GLD below, notice the descending triangle pattern that preceded last Friday’s breakdown below key horizontal price support:

Continue Reading...