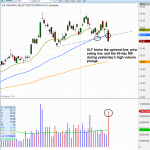
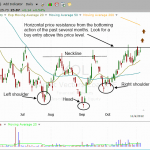
Going into today, we’re stalking a new potential ETF buy entry in Market Vectors Coal ETF ($KOL). After being in downtrend from April 2011 until September 2012, KOL is now setting up as a short-term, momentum-based bullish trend reversal play. On the daily chart below, notice that the 20 day moving averages recently crossed above the 50 day moving average, which is a bullish signal, although the 200-day moving average (orange line above the current price) has not yet started sloping higher. Nevertheless, there is a clearly defined area of horizontal price support and daily chart, and the ETF is also formed a pattern that is similar to an inverse head and shoulders. The head and shoulders chart pattern is bearish when it forms near the highs after an extended rally, and usually leads to new near-term lows. Conversely, an inverse head and shoulders is bullish when it forms around the near-term lows of a protracted downtrend, and will frequently lead to new “swing highs.” On the chart below, we have annotated the components of the inverse head and shoulders pattern. Finally, notice that a breakout above the three-day high in KOL will also correspond to a breakout above a substantial area of horizontal price resistance, as well as the neckline of the inverse head and shoulders pattern. As such, we are adding KOL to our ETF watchlist as an “official” trade setup today.