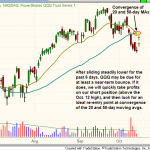
Given that the Nasdaq 100 Index has been drifting lower for the past six days (including last Friday’s flat closing price), it’s becoming a bit “oversold” in the near-term. We hesitate to use the term “oversold” because it’s a relative term and stocks and ETFs can frequently become much more “oversold” before eventually bouncing. Therefore, we use the term loosely. Nevertheless, odds now favor at least a short-term bounce off the lows in the coming week. As such, we have tightened our protective stop on ProShares Short QQQ ($PSQ) to just below last Friday’s (October 12) intraday low. This new stop price will still enable us to capture further gains if the Nasdaq 100 fails to bounce today and continues extending its losing streak. However, we will still quickly lock in a gain on the position if the Nasdaq suddenly bounces sharply higher or a “short squeeze” sets in.

Continue Reading...

For the third straight day, our open ETF positions performed well as the broad market showed weakness. The standout of the day was US Natural Gas Fund ($UNG), which zoomed 4.4% higher yesterday. More importantly, the commodity ETF broke out above its consolidation to a new “swing high.” Volume also rose above its 50-day average level, which confirmed the upward move. The daily chart pattern of UNG is now positioned for another leg higher within its intermediate-term uptrend that became established after the ETF formed two “higher highs” and two “higher lows” over the summer.

Continue Reading...

After a an explosive 20% move off the lows, silver has formed a tight, month long base above the 20-day exponential moving average. We also like the dry up in volume during the consolidation on the daily chart of the ProShares Ultra Silver ETF ($AGQ) below. $AGQ will have also formed a higher low within the base if the recent pullback to the 20-day EMA holds. There is also a bullish trend reversal signal with the 50-day moving average recently crossing above the 200-day moving average (please reference $SLV to see the crossover). Also of note is the 200-day moving average, which is now beginning to slope higher over the past month. Our official buy entry is over the two-day high, which is above the bullish reversal candle of October 9.

Continue Reading...

Despite the bearishness of yesterday’s session, our open ETF positions had a great day! Going into yesterday (October 9), we were already long both First Trust Natural Gas Index ($FCG) and a partial position of iShares Colombia Index ($GXG). FCG, whose portfolio of individual stocks often move in a similar direction to the price of natural gas futures, ignored the broad market weakness and rallied to a 1.2% gain. GXG, an international ETF with a relatively low correlation to the direction of the US stock market, edged just 0.2% lower. Additionally, both ETFs on our watchlist going into yesterday triggered for buy entry as well. Cruising 2.3% higher, the US Natural Gas Fund ($UNG) followed through on its bull flag pattern that we pointed out in the October 9 report. The other ETF that triggered for buy entry was ProShares Short QQQ ($PSQ), which inversely tracks the price of the Nasdaq 100 Index (recall our October 8 analysis of the bearish “head and shoulders” pattern that had formed on the index). As the Nasdaq 100 Index lost 1.6% and sliced below support of its 50-day moving average yesterday, PSQ conversely rallied 1.7% and broke out above resistance of its 50-day moving average. Putting the performance of all four ETF positions together, here was the individual scorecard for yesterday: +2.3%, +1.6%, +1.2%, and -0.2% (on a half-sized position). Obviously, that made for a pretty nice day considering the substantial losses in the broad market. In fact, it would have been a great day even if the main stock market indexes would have rallied yesterday.

Continue Reading...

Last week, on October 2, we locked in an 11% gain on a trade in US Natural Gas Fund ($UNG), a commodity ETF designed to roughly track the price of natural gas futures contracts. As you may recall, we sold the ETF into strength as it came within pennies of our original upside price target. In the following day’s ETF commentary, we said we would be looking for a potential, low-risk re-entry buy point into UNG. Specifically, we said, “Even though we have closed this trade, UNG could still move much higher in the intermediate-term. The rally over the past week was a breakout above a valid base of consolidation, which could set into motion a new intermediate-term uptrend for this ETF. As such, UNG is now on our radar screen for potential re-entry after it either pulls back or forms a bull flag chart pattern. There is a good chance we will be able to re-enter the trade at a slightly lower price, or possibly near the current price, but with a more positive reward to risk ratio after UNG undergoes at least a near-term correction.”

Continue Reading...

Going into this week, there are 5 objective, technical reasons why we feel the stock market may be poised for a significant pullback: Four “distribution days” on the Nasdaq, Lack of increasing volume as the market has been rising, Key short-term resistance levels being tested on the S&P and Dow ($SPY and $DIA), Head and Shoulders pattern on the Nasdaq 100 ($QQQ), Relative weakness in the small and mid-cap indexes ($IWM and $MDY)

Continue Reading...

Recently, we discussed a potential trade setup in Global X Colombia 20 ($GXG), an international ETF that obviously tracks the performance of Colombian stocks. When we first pointed out the potential trade setup last week, we said it may be a little bit too early to enter the trade. However, the price action has tightened up considerably since then, which leads us to believe that a breakout to new “swing highs” will soon occur. On the longer-term weekly chart below, notice that GXG broke out above horizontal price resistance last month, and has been consolidating in a sideways range over the past four weeks.

Continue Reading...

In mid-September, we pointed out the relative strength that was being exhibited by the banking sector. Specifically, we looked at the chart pattern of S&P Regional Bank SPDR ($KRE) because it was showing the most relative strength among the various financial or banking ETFs. At the time, we were looking for a pullback in KRE that would’ve provided us with a positive reward to risk ratio for new swing trade entry. As anticipated, KRE indeed pulled back to near-term support of its 20-day exponential moving average about one week after our initial analysis, but the ETF never provided us with an ideal buy entry. This is because the pullback is taking too long, and KRE has not yet formed a bullish reversal bar on its daily chart either. Nevertheless, KRE is still holding support in a very tight, sideways trading range over the past six days.

Continue Reading...

If you have just signed up for our Wagner Daily newsletter within the past two weeks, we would like you to realize the broad market has already made an extended run, and we have already booked some nice winning trades in recent weeks (you can view our Q3 trade performance details here). Because the stock market has been in pullback mode lately, our open positions have not gained as much ground as they did last month. When this occurs and our positions do not act as expected, we definitely take notice and proactively attempt to reduce risk by raising our protective stops and/or reducing share size. During periods of market transition or indecision, it is crucial to proactively do something with trades that are not moving much, rather than simply trading with blinders on.

Continue Reading...

In late August, we bought a bull flag breakout in gold ($DGP), which we sold into strength for a near 10% gain on a six day hold. Along with gold, we are monitoring iShares Silver Trust ($SLV) for a potential breakout entry within the next few weeks. After a strong run up off the lows, we would welcome a tight four to six week consolidation at the highs. Ideally, we’d like to see SLV put in one or two higher swing lows while holding above 32.00.

Continue Reading...