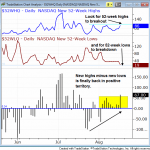
With the market pushing higher we are looking for breadth to expand to confirm the market advance and we are beginning to see that with small cap stocks waking up. Another tool we use to monitor the breadth is a simple chart of stocks making new 52-week highs minus stocks making new 52-week lows. The chart below shows Nasdaq New Highs vs. New Lows. Note that the lines are going in the right direction, with 52-week highs (blue line) putting in higher lows and poised to breakout above the prior swing highs. The 52-week lows line (red line) is setting lower highs and poised to breakdown beneath the summer lows.

Continue Reading...

In the August 10 issue of The Wagner Daily, we pointed out the relative strength (daily chart) and potential breakout to a new all-time high (weekly chart) in iShares Mexico Index ($EWW). Over the next two days that followed, EWW drifted lower, then “undercut” near-term support of its 20-day exponential moving average yesterday morning (August 15), but rallied to settle 0.9% higher by the closing bell. This resulted in the formation of a bullish reversal candle that coincided with an “undercut” of an obvious level of support. These, as we frequently discuss, are the best types of pullback entries because the “undercuts” of support absorb overhead supply that enable the ETF to more easily move higher. Now, the ETF is just 21 cents below our trigger price for partial swing trade buy entry (above the high of August 13).

Continue Reading...

Since August 9, the iShares Nasdaq Biotechnology Index Fund ETF ($IBB) has been on our watchlist as a potential pullback trade entry. Though it has not yet traded through our trigger price, it formed a bullish hammer candlestick pattern yesterday, which could lead to upside follow-through in today’s session. Further, it “undercut” (briefly dipped below) near-term support of its 20-day exponential moving average, as well as the low of its six-day trading range. This is illustrated on the daily chart pattern of IBB below…

Continue Reading...

Over the past several weeks, the iShares Dow Jones Select Dividend Index ETF ($DVY) has been consolidating near its multi-year high. With the exception of one day (July 31), volume has also been coming in lighter than average (a bullish sign when stocks are consolidating for potential breakout). Over the past three days, the trading range has tightened up substantially, which is often a precursor to a breakout from consolidation. Just below last Friday’s low lies near-term support of the 20-day exponential moving average (EMA). Now, we are targeting DVY for a potential breakout entry, which would occur on a volume-fueled move above last Friday’s (August 10) high of $57.59. This buy setup in DVY is an “official” play that has been added to our watchlist, where you will find our detailed trade parameters.

Continue Reading...

With the U.S. markets rather lethargic and showing a lack of conviction, we have been scanning for potential trade setups among the international ETFs. Most of the international ETFs we looked at have badly damaged weekly chart patterns that we are not interested in trading because it goes against our core trading strategy. But one international ETF in a nice consolidation pattern, poised for a breakout to a new record high is iShares Mexico ($EWW). On the long-term monthly chart below, which shows you the “big picture” of its trend, notice that EWW is presently testing resistance of its all-time high. If it breaks out above the horizontal line annotate on the chart, there will be a complete lack of overhead supply and price resistance that should enable EWW to zoom higher…

Continue Reading...

Presently pulling back modestly off its all-time high, the iShares Nasdaq Biotechnology ETF ($IBB) has been showing clear relative strength to the broad market. Since snapping back above support of its 20-day EMA on August 3rd, IBB has been consolidating in a tight range for the past four days. Now, IBB offers a possible swing trade buying opportunity on a breakout above that four-day high of $134.32, with a protective stop below the 4-day low. Subscribers should note our exact entry and exit prices for this trade setup in “today’s watchlist” section of this newsletter above. The daily chart of IBB shows the trade setup…

Continue Reading...

Yesterday, the PowerShares Nasdaq Composite ETF (QQQ) rallied into resistance of the upper trend line of its trend channel, and then sold off to close in the middle of the intraday range. Yesterday’s high should now serve as a significant resistance level for QQQ. Above this key mark, QQQ has resistance at $67.70 and $68.60. Should QQQ pull back from the current level, it should find support near $65.25 (the breakout), $64.50 (20-day EMA) and $63.40 (50-day MA).

Continue Reading...

The iShares MSCI Mexico Investable Market ETF (EWW) has shown excellent relative strength since gapping up in June of this year. During this time it has been consolidating along its 20-day EMA, as it has set a sequence of higher-lows. EWW offers a potential buy entry on a pullback and undercut of its 10-day or 20-day moving average. As always, we will be watching for the formation of a reversal candle as the pivot for a potential buy entry.

Continue Reading...

The SPDR S&P Homebuilders ETF (XHB) has been one of the strongest ETFs in the market over the past several months. Last Thursday XHB formed a bullish reversal candle which was followed by Friday’s gap up. Although this price action is bullish, it does not provide an entry suitable to taking on the trade. In order for XHB to provide a quality buying opportunity we would like to see it set a “higher-low” and another “buy-pivot” similar to the reversal candle formed last Thursday. Under these circumstances we would consider XHB a potential buy entry over the new pivot.

Continue Reading...