Commentary:
After an explosive breakout day on November 4th, Friday’s trading action was subdued. The major indices were stuck in a choppy trading range for most of the day. However, stocks did manage a late day bounce that moved the major averages into positive territory at the close. On the day, the S&P MidCap 400 led all indices by posting a 0.6% gain. Following closely behind, both the S&P 500 and the small-cap Russell 2000 finished up 0.4%. The Dow Jones Industrial Average and the Nasdaq both managed slim 0.1% gains for the session.
Turnover fell across the board in Friday’s trade. Nasdaq volume dropped significantly, as It finished down by 17%. On the NYSE, volume dropped by a more modest 5%. Advancing volume outpaced declining volume by a ratio of 2.3 to 1 on the NYSE. Although positive, the advancing volume to declining volume ratio was only 1.3 to 1 on the Nasdaq. The internals suggest that the market was “catching its breath”, following Thursday’s monster rally.
In Wednesday’s newsletter, we placed the iShares Russell Microcap Index (IWC) on our official watchlist. IWC hit our buy “trigger” of $45.03, and we entered the trade. The 15 days of consolidation by this ETF, provided the “springboard” for the rally. This zone of consolidation now serves as a formidable level of support. IWC is now well positioned to continue its rally.
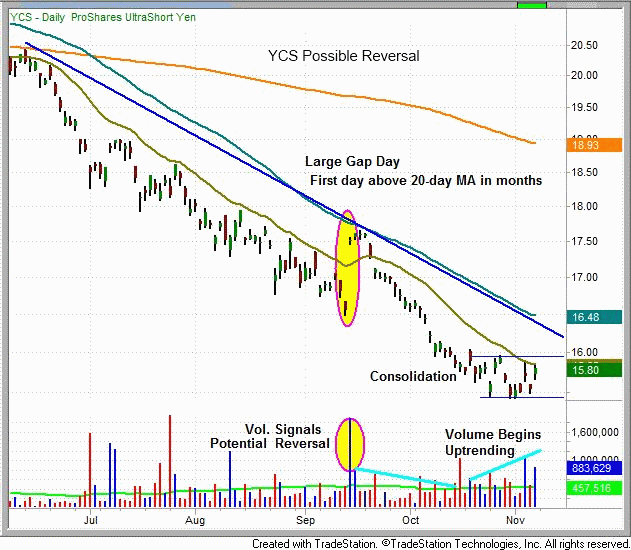
The ProShares UltraShort Yen (YCS), is exhibiting signs of bottoming. Prior to a reversal, it is common to see a significant volume spike that propels an ETF in the opposite direction of the prevailing trend. This spike is considered a leading indicator, and as such should not be used as a signal to immediately enter a trade. The spike in volume generally precedes the actual reversal by three to six weeks. In addition, the counter trend move often involves a gap-up, and the first breach of the 20-day MA after a protracted slide. Since the gap is the first test of the moving average, it often fails and the downtrend resumes. However, the volume begins to fade during this phase of the selloff. At some point, volume spikes and begins to trend upwards, but the ETF consolidates. In other words, the sudden increase in volume does not propel prices lower. YCS has been consolidating over the past 13 trading days. Its volume has been increasing during this timeframe. Yet, YCS has not moved lower. YCS has gapped up on strong volume, and tested the 20-day MA twice in the past four trading days. A potential buy signal would be triggered if YCS gapped above the consolidation zone. By no means are we calling a bottom in YCS. We have no interest in “bottom fishing.” YCS could easily resume its downtrend. However, the current technical pattern suggests that we should be aware of a possible reversal.

For the past 12 weeks the iShares Lehman Aggregate Bond Fund (AGG), has consolidated in a tight trading range. Additionally, AGG is consolidating at its all time highs. A break above the August 25th high of $109.09 could trigger a buy signal for this ETF. We will notify our members should a buy signal occur.

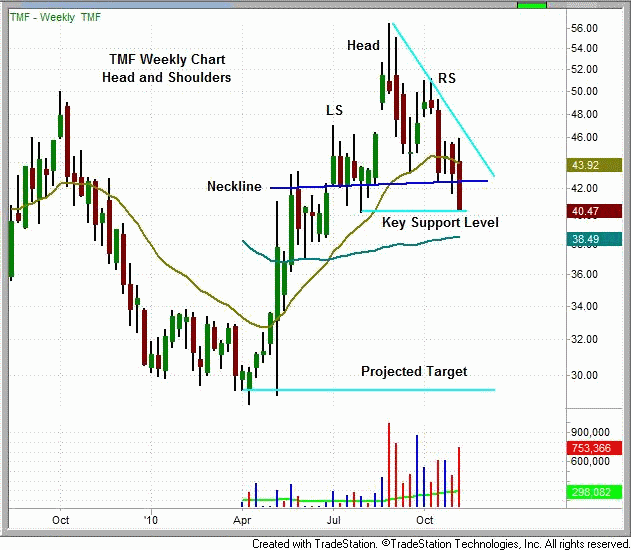
The Direxion Daily 20+ Year Treasury Bull 3x (TMF), has been in a downtrend for over two months. Further, it has formed a head and shoulders-like pattern. TMF is currently resting on a key support level just below the neckline. The 50-week MA also provides intermediate support. However, TMF appears to be headed lower. A rally into the neckline or downtrend line provides potential entry points to short this ETF. The projected target for this trade would be in the vicinity of $29.00.

As we stated in the November 5th newsletter, most ETFs are forming similar patterns. Consequently, we are inclined to be more cautious despite the recent strength in the market. When “laggards” begin moving the market, it is only wise to take notice. The uptrend remains intact, but there is evidence that the market is reaching an extreme. Nonetheless, until the market provides a clear signal of trend reversal, we remain respectful of the current market sentiment.
Today’s Watchlist:
There are no new official setups for today. We will send an Intraday Alert if any new trades are made.
Daily Performance Report:
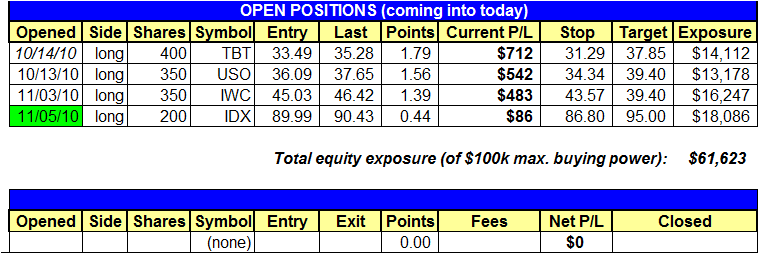
Below is an overview of all open positions, as well as a performance report on all positions that were closed only since the previous day’s newsletter. Net P/L figures are based on the $50,000 Wagner Daily model account size. Changes to open positions since the previous report are listed in red text below. Please review the Wagner Daily Subscriber Guide for important, automatic rules on trigger and stop prices
IDX long triggered.
- Reminder to subscribers – Intraday Trade Alerts to your e-mail and/or mobile phone are normally only sent to indicate a CHANGE to the pre-market plan that is detailed in each morning’s Wagner Daily. We sometimes send a courtesy alert just to confirm action that was already detailed in the pre-market newsletter, but this is not always the case. If no alert is received to the contrary, one should always assume we’re honoring all stops and trigger prices listed in each morning’s Wagner Daily. But whenever CHANGES to the pre-market stops or trigger prices are necessary, alerts are sent on an AS-NEEDED basis. Just a reminder of the purpose of Intraday Trade Alerts.
- For those of you whose ISPs occasionally deliver your e-mail with a delay, make sure you’re signed up to receive our free text message alerts sent to your mobile phone. This provides a great way to have redundancy on all Intraday Trade Alerts. Send your request to [email protected] if not already set up for this value-added feature we provide to subscribers.

Having trouble seeing the position summary graphic above?
Click here to view it directly on your Internet browser instead.
Notes:
Edited by Deron Wagner,
MTG Founder and
Head Trader