Commentary:
Friday’s trading brought an end to options expiration week and some unusual trading activity. There was a major divergence between the Nasdaq and all of the other major indices. The Nasdaq posted an impressive 1.4% gain. The other winners on the day were the S&P 500 and the S&P MidCap 400, but each posted minimal gains of 0.2% and 0.1% respectively. In contrast, the Dow Jones Industrial Average lost 0.3% and the small-cap Russell 2000 slipped 0.2% lower on the day. The impressive showing on the Nasdaq was undoubtedly skewed by the major price and volume explosions in Google (GOOG) and Apple (AAPL). Google announced a huge upside earnings surprise. Since this company represents 4% of the Nasdaq’s market weight, it likely fueled the entire Technology sector, which finished up 1.7% in Friday’s trading. Google gained 11% ($60) on the day. However, the financial sector did not fare so well. It got pounded on Friday, dropping 1.7%.
The market internals also provided some interesting divergence on the day. Although the Nasdaq was the big percentage gainer, it saw significantly lighter turnover than did the NYSE. Volume on the Nasdaq was up a solid 10%, however NYSE volume rocketed upward by 27%. Further, advancing volume outpaced declining volume on the NYSE by a factor of 16 to 1. But, on the Nasdaq, advancing volume only managed to beat declining volume by a ratio of 1.8 to 1. Also of interest, is the ratio of advancing to declining issues on both indices. The NYSE saw declining stocks outpace advancing stocks by 1.5 to 1, while declining versus advancing issues on the Nasdaq was about even. Nonetheless, there were slightly more losers than winners on the Nasdaq. The conflicting internal data may partially be a result of options expiration. However, it may also be suggesting that fewer stocks are participating in the rally. It is also not unusual to see this type of conflicting data near the end of a major trend. One thing is clear from Friday’s trading; the financial sector was met with institutional distribution. The major money center banks saw massive volume spikes and traded significantly down on the day. Citibank, Bank of America, Wells Fargo, General Electric and JP Morgan, all plummeted 3% to 5% on Friday. Overall, the conflicting information does suggest that we should be cautious at this point in the rally.
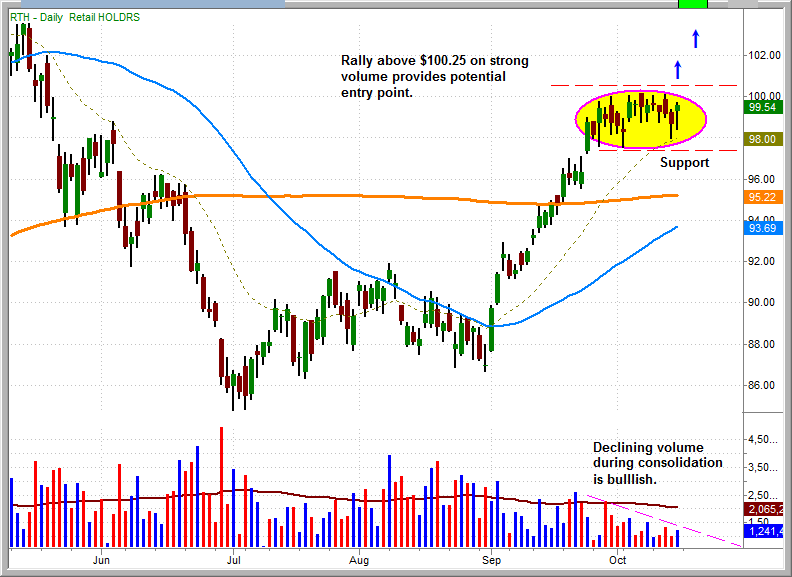
Since the September 24th gap up, the Retail Holders Trust (RTH) has been consolidating in a tight trading range, just above the 20-day exponential moving average, and on declining volume. This is the type of price and volume activity often precedes a breakout. A rally just above the three week high ($100.25) on increasing volume, would put RTH in play as a long entry. We like the fact that RTH has been consolidating during the most recent leg up in the broad market. In the event an entry was triggered for RTH, the recent three weeks of consolidation serves as significant support, should the market reverse. This helps to reduce the risk of the trade during an extended market rally.

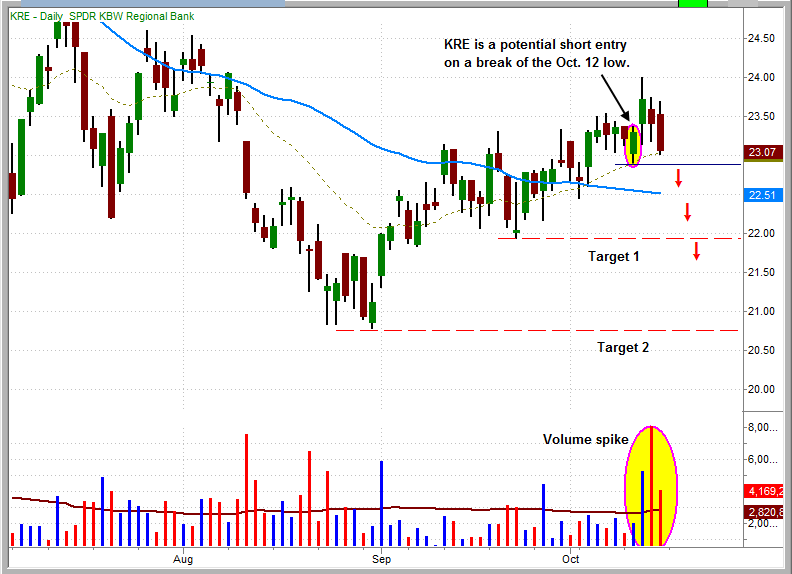
As noted earlier, the financial sector has been underperforming the broad market. Notably, the regional banks have underperformed the sector. The SPDR KBW Regional Banking ETF (KRE) is poised for a potential selloff. Note that KRE was never able to rally near the 200 day simple moving average, while the Select Sector SPDR Financial Trust (XLF) has rallied into the 200-day MA several times over the past two months. KRE has been met with selling pressure on a big increase in volume over the past three days. A break below the October 12th low of $22.90, could signal a shorting opportunity for this ETF. If the break occurs and volume remains strong, KRE could very well retest the August lows.

Although we still maintain a bullish slant, there are signs that the market is weakening. We are therefore cautious. In the absence of a strengthening banking sector, the rally may be losing the fuel it needs to maintain its current advance.
Today’s Watchlist:
There are no new official setups for today. As awlays, we will promptly send an intraday alert if anything catches our eye while trading.
Daily Performance Report:
Below is an overview of all open positions, as well as a performance report on all positions that were closed only since the previous day’s newsletter. Net P/L figures are based on the $50,000 Wagner Daily model account size. Changes to open positions since the previous report are listed in red text below. Please review the Wagner Daily Subscriber Guide for important, automatic rules on trigger and stop prices
- Reminder to subscribers – Intraday Trade Alerts to your e-mail and/or mobile phone are normally only sent to indicate a CHANGE to the pre-market plan that is detailed in each morning’s Wagner Daily. We sometimes send a courtesy alert just to confirm action that was already detailed in the pre-market newsletter, but this is not always the case. If no alert is received to the contrary, one should always assume we’re honoring all stops and trigger prices listed in each morning’s Wagner Daily. But whenever CHANGES to the pre-market stops or trigger prices are necessary, alerts are sent on an AS-NEEDED basis. Just a reminder of the purpose of Intraday Trade Alerts.
- For those of you whose ISPs occasionally deliver your e-mail with a delay, make sure you’re signed up to receive our free text message alerts sent to your mobile phone. This provides a great way to have redundancy on all Intraday Trade Alerts. Send your request to [email protected] if not already set up for this value-added feature we provide to subscribers.

Having trouble seeing the position summary graphic above?
Click here to view it directly on your Internet browser instead.
Notes:
Edited by Deron Wagner,
MTG Founder and
Head Trader