Commentary:
The major indices closed mixed on Monday, with the lower beta blue chips exhibiting the most strength. At the open, the market gapped up but was met quickly by a wave selling. Stocks then clawed their way back to session highs, only to be met with high volume selling into the close. For most of the day it appeared that the Dow would close above its November 5th high of 11,452, thus confirming the move already made last week by the other four indices. But the absence of institutional commitment resulted in a false breakout and a return to the trading range for the Dow. Despite the late day selling, the Dow Jones Industrial Average closed up 0.2% yesterday. The S&P 500 ended the session flat, while the small-cap Russell 2000, the Nasdaq and the S&P MidCap 400 shed 0.6%, 0.5% and 0.3% respectively
Turnover was mixed in Monday’s action. Day over day volume on the NYSE declined by 4.1% and likely explains the DJIA’s inability to hold the breakout. Trade on the Nasdaq increased by 5% on Monday, but declining volume outpaced advancing volume by 2.5 to 1. GIVEN THE RECENT ADVANCE OF SMALL AND MIDCAP STOCKS, YESTERDAY’S SELLING WAS NOT SURPRISING. Although volume declined on the NYSE, the ratio of advancing to declining volume finished the day at a positive 1.3 to 1. The absence of strong broad market internals seems to be handcuffing an all out bullish advance.
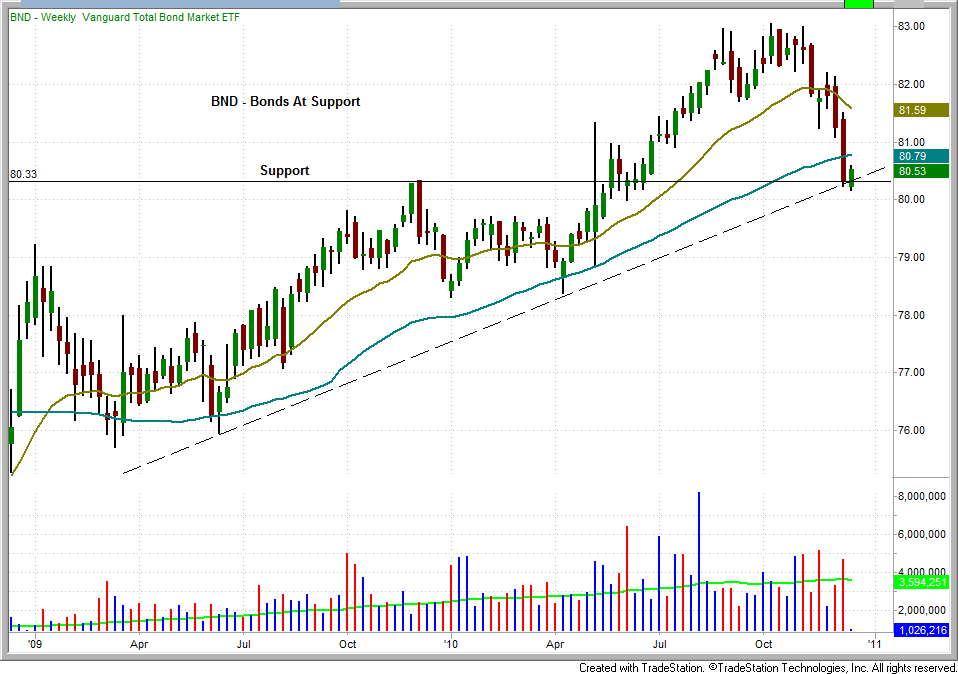
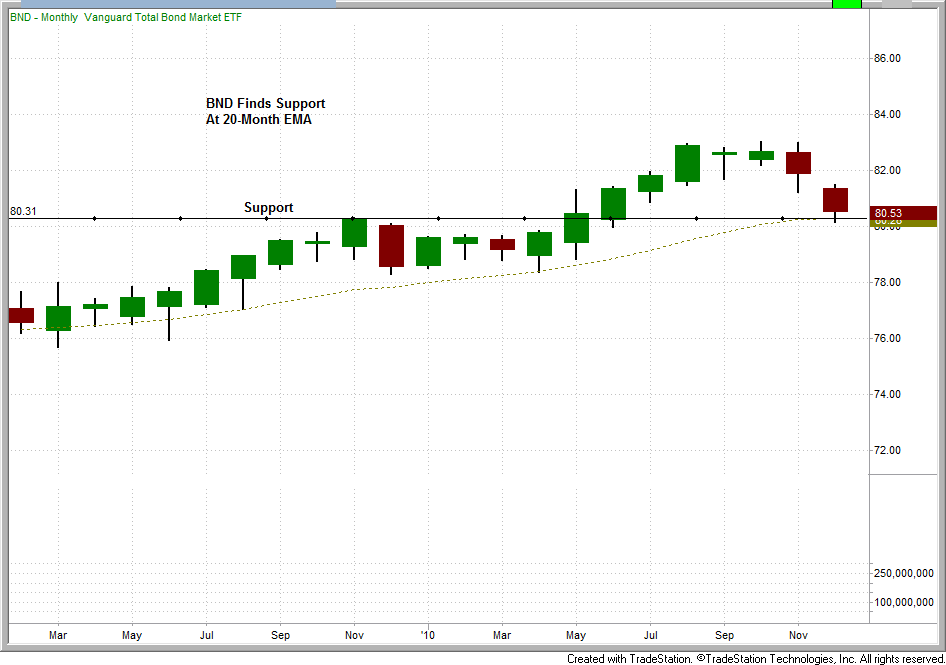
The Vanguard Total Bond Market ETF (BND) is now resting at a key support level since the vicious selling began in this ETF in early November. A quick review of the weekly and monthly charts below, provide evidence that the bond market may see a relief rally over the next several days. A move above the weekly high of $80.60 presents a potential buying opportunity for BND.
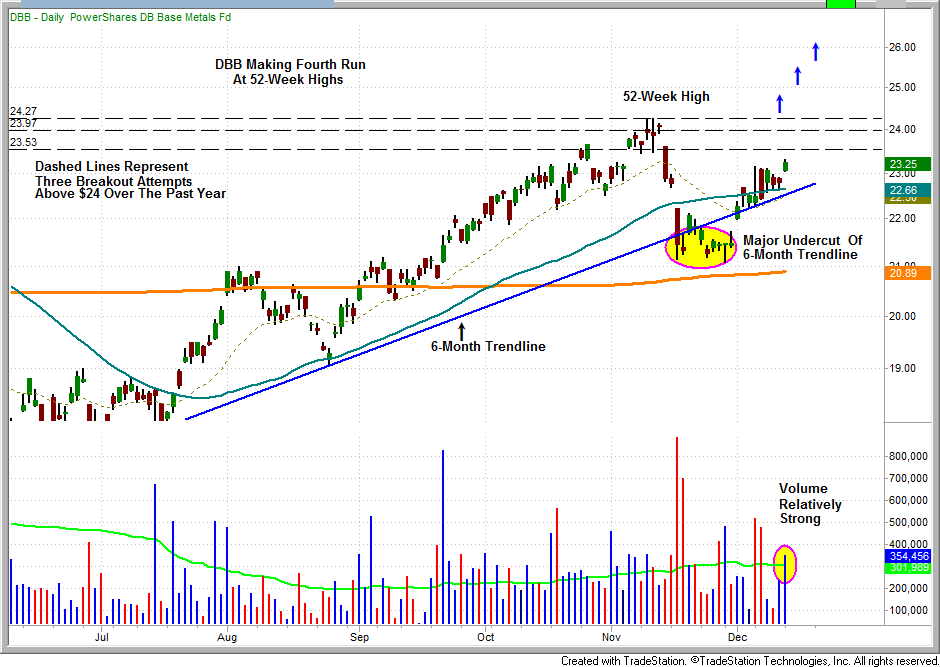
Since January of this year, the PowerShares DB Base Metals ETF (DBB), has thrice attempted to rally above $24.00. Recently, this ETF was met with brisk selling that resulted in a significant undercut of the 20-day EMA, 50-day MA and the six month trend line. On December 1st DBB reclaimed its trend line. Since then it consolidated for seven days, and yesterday it gapped and rallied above the seven day high. The rally was accompanied by a solid increase in volume relative to broad market volume. If DBB can manage its way above the triple top on a burst in volume, it could make a run at the all time high of $29.70.
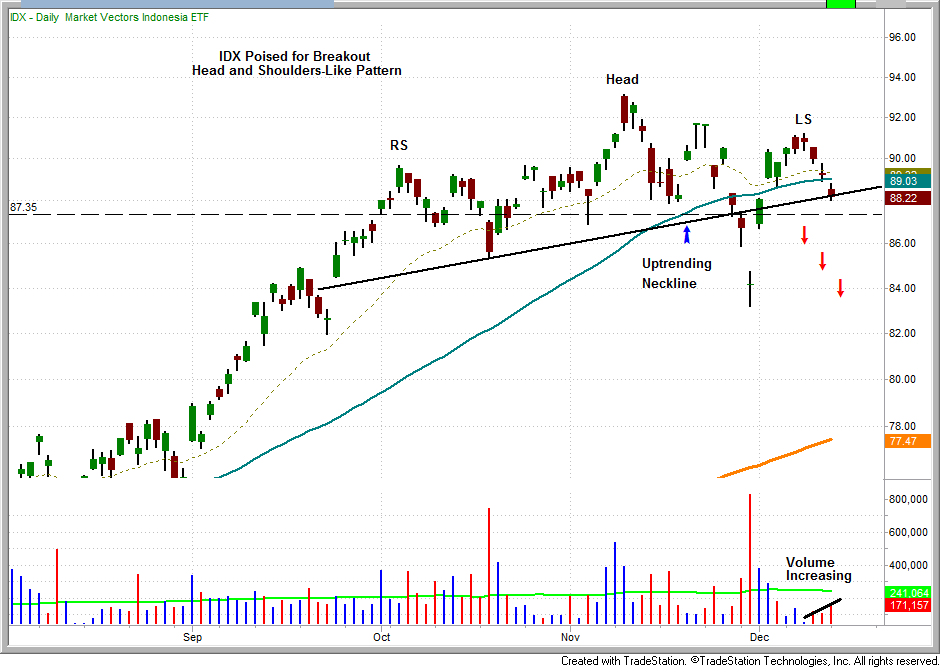
Over the past several weeks the Market Vectors Indonesia ETF (IDX) has exhibited relative weakness compared to many other emerging market ETFs. Over the past three months IDX has formed an up-trending head and shoulders type pattern. On November 30th IDX lost support on a massive increase in volume, but managed to recover quickly. On Monday IDX lost support of the 20-day EMA and the 50-day MA on increasing volume. This could represent a “shakeout” undercut of these key moving averages. But, given the weakness exhibited by this ETF on November 30th, the current price and volume action take on more significance. A move below $87.30 would likely present a shorting opportunity for IDX. Since this is a counter trend setup, it carries more risk. It is not an official call but we are monitoring it closely.
False breakouts as witnessed in the Dow today, have been a bullish trademark of the market advance for well over a year. If recent market action maintains form, we would expect to see a Dow fueled, broad market rally soon. But given the recent pullback of the bond market into key support, a few days of consolidation or selling would not be unusual.
Today’s Watchlist:
There are no new official setups this morning. We will send an intraday alert if any new trades are made.
Daily Performance Report:
Below is an overview of all open positions, as well as a performance report on all positions that were closed only since the previous day’s newsletter. Net P/L figures are based on the $50,000 Wagner Daily model account size. Changes to open positions since the previous report are listed in red text below. Please review the Wagner Daily Subscriber Guide for important, automatic rules on trigger and stop prices
No changes to our open positions at this time.
- Reminder to subscribers – Intraday Trade Alerts to your e-mail and/or mobile phone are normally only sent to indicate a CHANGE to the pre-market plan that is detailed in each morning’s Wagner Daily. We sometimes send a courtesy alert just to confirm action that was already detailed in the pre-market newsletter, but this is not always the case. If no alert is received to the contrary, one should always assume we’re honoring all stops and trigger prices listed in each morning’s Wagner Daily. But whenever CHANGES to the pre-market stops or trigger prices are necessary, alerts are sent on an AS-NEEDED basis. Just a reminder of the purpose of Intraday Trade Alerts.
- For those of you whose ISPs occasionally deliver your e-mail with a delay, make sure you’re signed up to receive our free text message alerts sent to your mobile phone. This provides a great way to have redundancy on all Intraday Trade Alerts. Send your request to [email protected] if not already set up for this value-added feature we provide to subscribers.
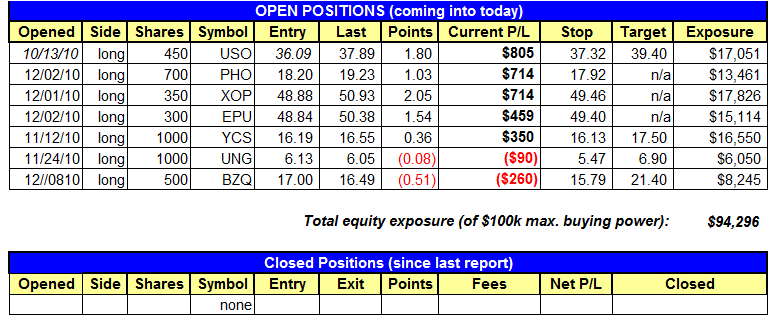
Having trouble seeing the position summary graphic above?
Click here to view it directly on your Internet browser instead.
Notes:
Edited by Deron Wagner,
MTG Founder and
Head Trader